* ACCUs = Australian Carbon Credit Units.
Australia
Emissions
Emissions Revisions Carbon Credits Corporate Sector Electricity TransportEnergy
Energy Renewables Solar Installations Fuel Imports & ExportsTransport
Transport Electric Vehicles Fuel* ACCUs = Australian Carbon Credit Units.
Aus
Cumulative Total - Carbon Credit Units Issued
Aus
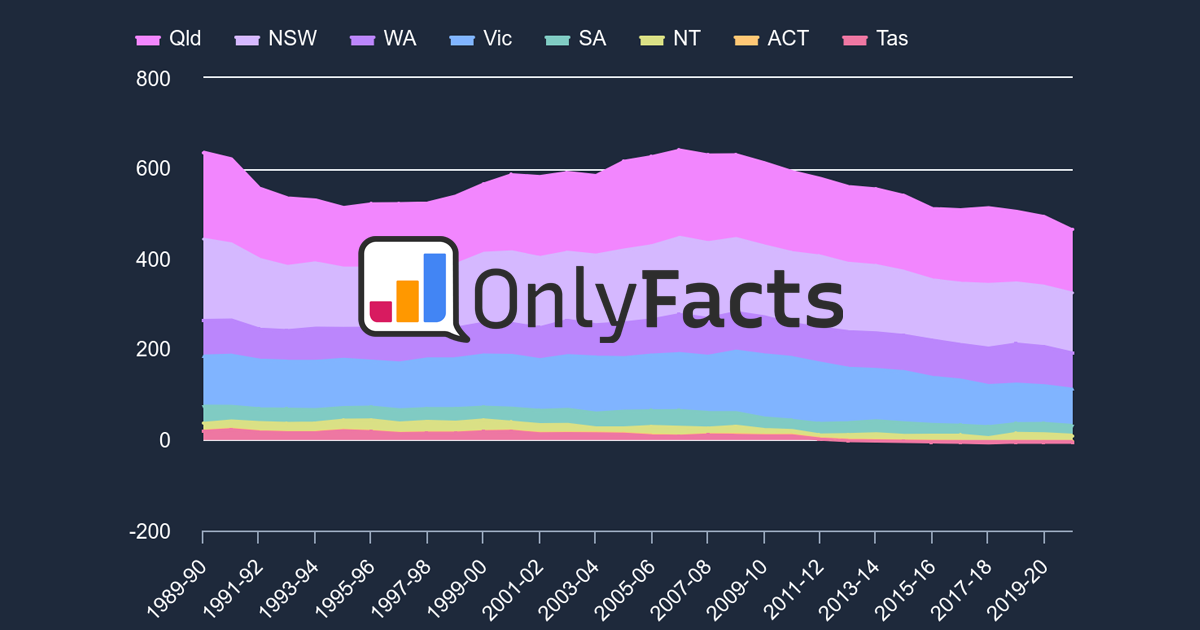
History - Carbon Credit Units Issued
|
YEAR |
KYOTO |
NON-KYOTO |
TOTAL |
|---|---|---|---|
| 2012-13 | 8,169 | 0 | 8,169 |
| 2013-14 | 39,068 | 0 | 39,068 |
| 2014-15 | 53,975 | 0 | 53,975 |
| 2015-16 | 97,432 | 0 | 97,432 |
| 2016-17 | 111,651 | 0 | 111,651 |
| 2017-18 | 120,888 | 0 | 120,888 |
| 2018-19 | 147,738 | 0 | 147,738 |
| 2019-20 | 276,364 | 0 | 276,364 |
| 2020-21 | 433,818 | 0 | 433,818 |
| 2021-22 | 310,775 | 0 | 310,775 |
| 2022-23 | 535,936 | 0 | 535,936 |
| 2023-24 | 229,921 | 0 | 229,921 |
| 2024-25 | 199,873 | 0 | 199,873 |
Never miss a beat
Get the free weekly climate briefing sent to your inbox, and you’ll never miss a data update or insight.