1. Data

What is Mt CO₂-e? Emissions are a combination of gases. Most are Carbon Dioxide (CO₂). The other gases are measured as a Carbon Dioxide equivalent (CO₂-e) based on the amount of heat they trap in the atmosphere. They’re measured in Million Tonnes (Mt).

Total emissions reduction

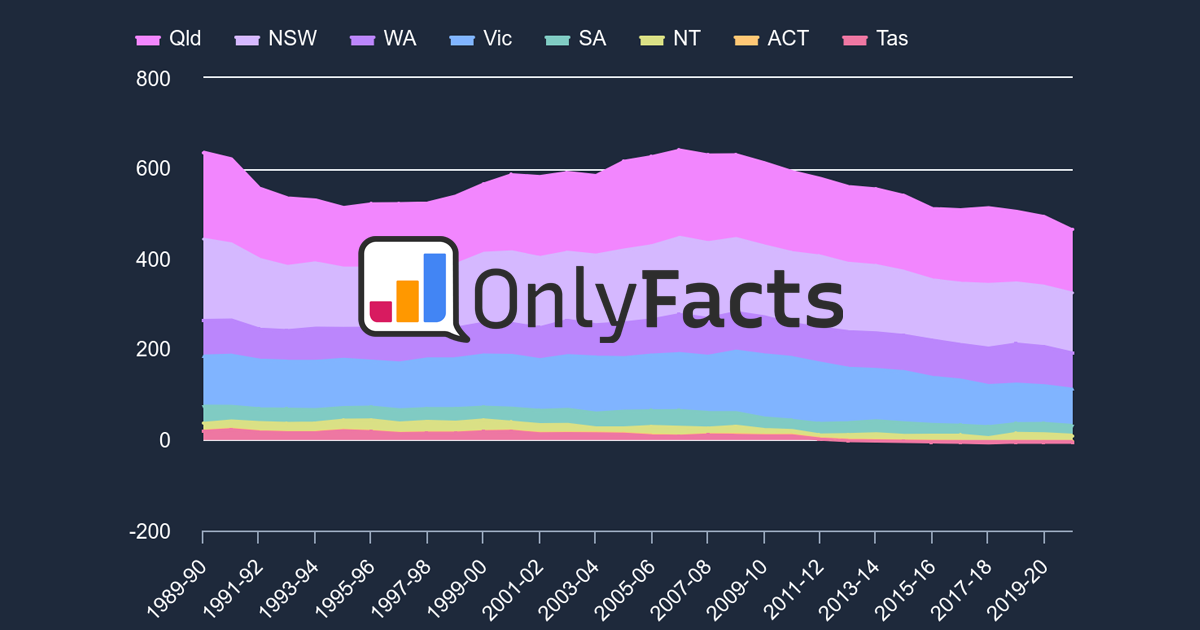
AUS Emissions History

Australia

Source: DCCEEW via OnlyFacts

Data

12 months to Jun 24 - Mt CO₂-e

Australia

YEAR

Mt CO₂-e

NET

v 2005

2004-05 613.4 - 0
2005-06 649.8 5.9% 5.9%
2006-07 630.9 2.9% 2.9%
2007-08 619.3 1.8% 1.0%
2008-09 612.6 1.1% 0.1%
2009-10 613.9 0.2% 0.1%
2010-11 582.4 5.1% 5.1%
2011-12 559.5 3.9% 8.8%
2012-13 561.9 0.4% 8.4%
2013-14 543.2 3.3% 11.5%
2014-15 538.6 0.8% 12.2%
2015-16 495.6 8.0% 19.2%
2016-17 534.7 7.9% 12.8%
2017-18 507.4 5.1% 17.3%
2018-19 496.5 2.2% 19.1%
2019-20 480.3 3.3% 21.7%
2020-21 444.5 7.5% 27.5%
2021-22 438.4 1.4% 28.5%
2022-23 444.6 1.4% 27.5%
Latest quarter 440.8 0.9% 28.1%

Data

Emissions History v 2005

Australia

YEAR

Mt CO₂-e

NET

v 2005

1989-90 615.4 - 1.0%
1990-91 595.0 3.3% 2.4%
1991-92 554.5 6.8% 9.0%
1992-93 533.5 3.8% 12.5%
1993-94 523.4 1.9% 14.1%
1994-95 511.0 2.4% 16.2%
1995-96 512.2 0.2% 16.0%
1996-97 510.3 0.4% 16.3%
1997-98 527.9 3.5% 13.4%
1998-99 548.3 3.9% 10.0%
1999-00 569.8 3.9% 6.5%
2000-01 586.5 2.9% 3.8%
2001-02 591.0 0.8% 3.0%
2002-03 590.5 0.1% 3.1%
2003-04 574.7 2.7% 5.7%
2004-05 609.4 6.0% 0
2005-06 644.9 5.8% 5.8%
2006-07 626.1 2.9% 2.7%
2007-08 614.6 1.8% 0.9%
2008-09 607.9 1.1% 0.3%
2009-10 609.2 0.2% 0.0%
2010-11 577.6 5.2% 5.2%
2011-12 554.7 4.0% 9.0%
2012-13 557.1 0.4% 8.6%
2013-14 538.3 3.4% 11.7%
2014-15 533.7 0.9% 12.4%
2015-16 491.1 8.0% 19.4%
2016-17 528.9 7.7% 13.2%
2017-18 501.7 5.2% 17.7%
2018-19 490.7 2.2% 19.5%
2019-20 474.5 3.3% 22.1%
2020-21 438.7 7.5% 28.0%
2021-22 432.6 1.4% 29.0%

Source: DCCEEW via OnlyFacts

News

Sign up to the free weekly climate data briefing