1. Electric Vehicles

Electric Vehicles

Latest Data (Nov 1)

% EV + PHEV Sales
+0.2%
9.4%
% EV + PHEV Registrations
+0.4%
0.8%
% Hybrid Sales
-0.3%
14.6%
% Hybrid Registrations
+0.5%
2.2%

EV + Plug-in EV Sales

Data

AUS

EV + Plug-in EV Sales

DATE

VEHICLES

NET

Apr 2024 7,494 36.9%
May 2024 10,347 38.1%
Jun 2024 11,532 11.5%
Jul 2024 8,952 22.4%
Aug 2024 8,536 4.6%
Sep 2024 8,892 4.2%
Oct 2024 8,821 0.8%
Nov 2024 9,175 4.0%

Source: FCAI via OnlyFacts | Updated: 04-12-24

Trend

AUS

EV + Plug-in EV Sales

Source: IEA via OnlyFacts | Updated: 04-12-24

EV + Plug-in EV Registrations

Data

AUS

EV + Plug-in EV Registrations

DATE

VEHICLES

NET

Jan 2021 19,876 -
Jan 2022 39,422 98.3%
Jan 2023 79,760 102.3%
Jan 2024 167,885 110.5%

Source: BITRE via OnlyFacts | Updated: 01-08-24

Comparison

AUS

EV + Plug-in EV Registrations

Source: BITRE via OnlyFacts | Updated: 01-08-24

States and Territories

Data

AUS

States and Territories

STATE / TERRITORY

EV/PHEV

TOTAL

%

NSW 216,392 6,295,676 3.4%
Vic 156,524 5,514,653 2.8%
Qld 132,743 4,752,593 2.8%
WA 66,919 2,528,676 2.6%
SA 43,154 1,597,727 2.7%
ACT 18,462 337,821 5.5%
Tas 10,852 541,151 2.0%
NT 4,245 168,669 2.5%
Australia 649,291 21,736,966 3.0%

Source: BITRE via OnlyFacts | Updated: 01-08-24

Trend

AUS

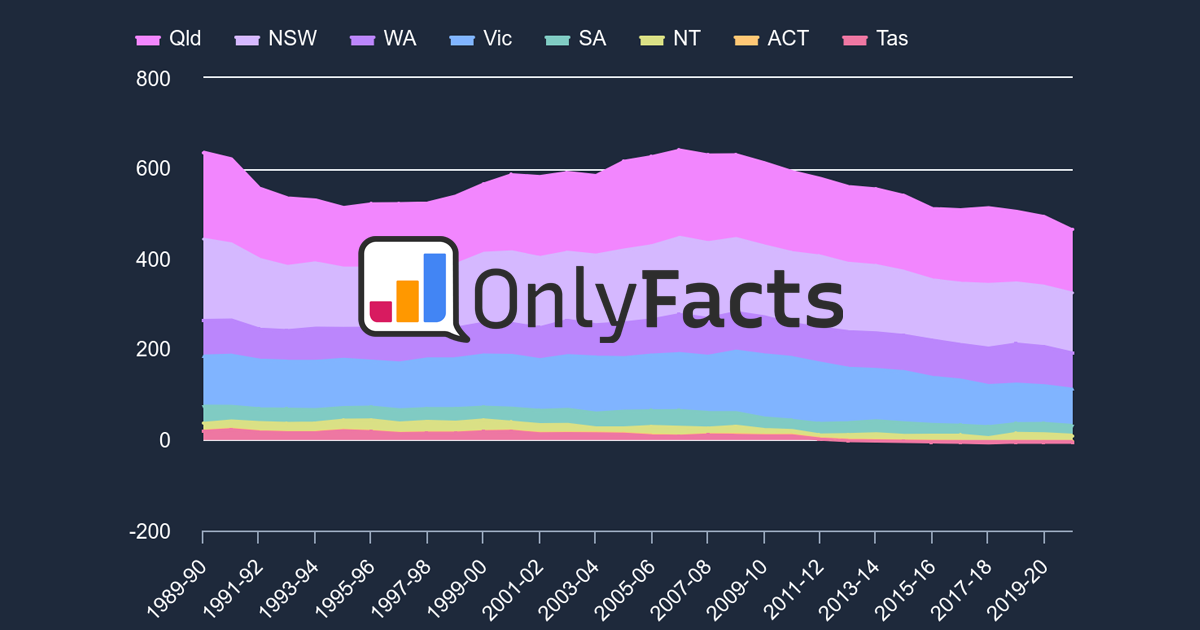
States and Territories

Source: BITRE via OnlyFacts | Updated: 01-08-24

Top Postcodes

All Postcodes

Explainer

Electric cars make up a tiny fraction of Australia’s roughly 22 million registered vehicles.

Australia has no official target for electric vehicle sales or registrations, however:

  • The International Energy Agency (IEA) says around 60% of new cars sold need to be battery electric or plug-in hybrid electric (EV/PHEV) by 2030.
  • The Economist says 17% of the world’s registered cars need to be EV/PHEV.

This data shows EV/PHEV registrations as a percentage of total vehicle registrations in each postcode in Australia.

Data

AUS

Top Postcodes

POSTCODE

EV/PHEV

TOTAL

%

RANK

4001 411 1,619 25% 1
2045 1,185 6,257 19% 2
5950 1,004 5,338 19% 3
4000 4,964 38,087 13% 4
4066 1,906 15,014 13% 5
2000 2,878 22,732 13% 6
2609 935 7,589 12% 7
2011 1,252 10,187 12% 8
2601 349 2,858 12% 9
4008 2,997 25,767 12% 10

Source: BITRE via OnlyFacts | Updated: 01-08-24

News

Sign up to the free weekly climate data briefing