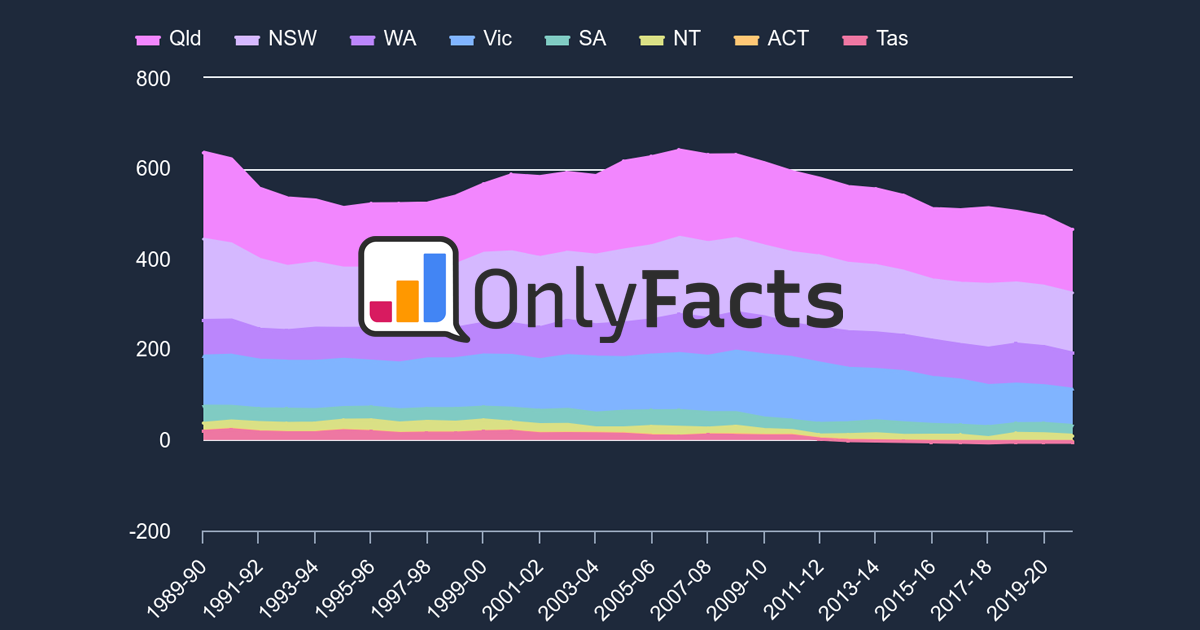
Let's compare two things: today's reality and tomorrow's projections.
Aus
EV Sales in Australia
DATE |
VEHICLES |
NET |
---|---|---|
Apr 2024 | 7,494 | 36.9% |
May 2024 | 10,347 | 38.1% |
Jun 2024 | 11,532 | 11.5% |
Jul 2024 | 8,952 | 22.4% |
Aug 2024 | 8,536 | 4.6% |
Sep 2024 | 8,892 | 4.2% |
Oct 2024 | 8,821 | 0.8% |
Nov 2024 | 9,175 | 4.0% |
Aus
State and Territory Vehicle Registrations
Aus
Vehicle Registrations
Aus, Lga
Vehicle Registrations
LGA |
EV/PHEV |
TOTAL |
% |
RANK |
---|---|---|---|---|
Adelaide | 2,395 | 26,545 | 9.0% | 1 |
Sydney | 9,334 | 116,154 | 8.0% | 2 |
Melbourne | 8,781 | 117,506 | 7.5% | 3 |
Willoughby | 2,993 | 40,523 | 7.4% | 4 |
Woollahra | 2,471 | 35,993 | 6.9% | 5 |
Ku-ring-gai | 6,321 | 93,823 | 6.7% | 6 |
Strathfield | 2,382 | 35,392 | 6.7% | 7 |
North Sydney | 3,670 | 55,378 | 6.6% | 8 |
Ryde | 6,029 | 93,627 | 6.4% | 9 |
Mosman | 1,244 | 19,400 | 6.4% | 10 |