As a purpose-driven fact tank, we want to make it as easy as possible to reuse our data, charts, and insights.
Australia
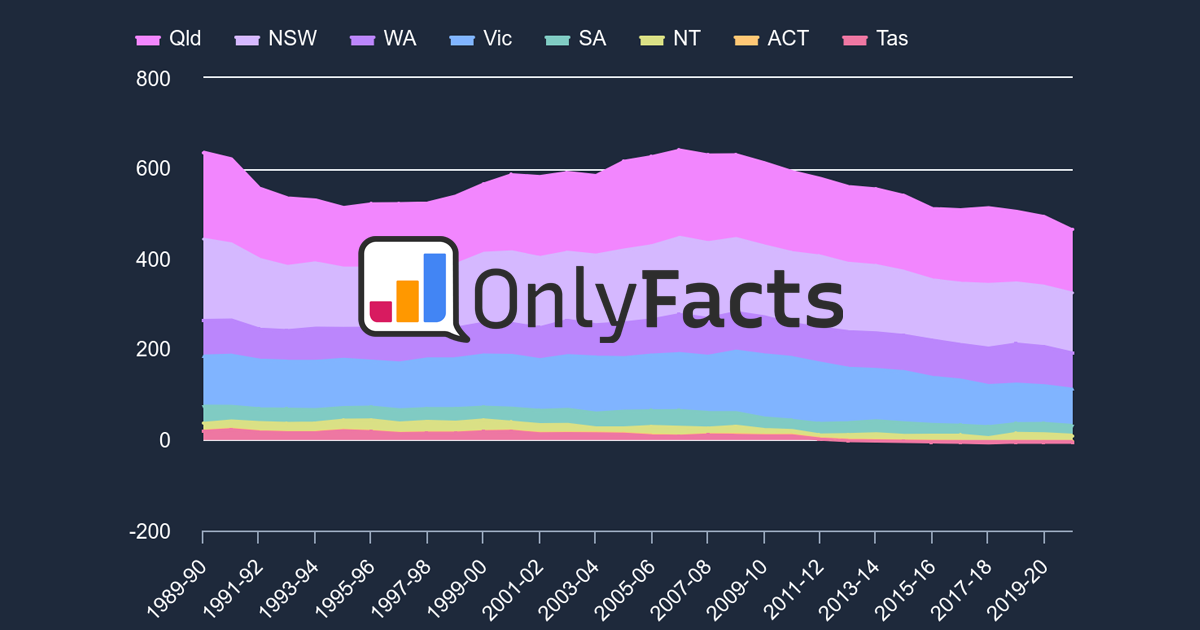
Emissions
Emissions Exported Emissions Corporate Major Facilities Sectors Carbon CreditsEnergy
Energy Fuel Renewables Solar Renewables Capacity InstallationsTransport
Transport Electric Vehicles Fuel