May 02, 2025
6 min read
🏭 Inside Australia’s Biggest Polluters: New Data Now Live
On this page
Hi, and welcome to your climate data briefing—on the eve of the federal election!
We’ve been deep in the weeds of emissions data from Australia’s biggest industrial polluters.
The first version of our dataset is now live on the site. We’d love you to explore it—and tell us what you think.
The Clean Energy Regulator (CER) publishes this data but our goal is to make it more accessible—clear, useful, and easier to navigate for non-specialists.
Below is a quick rundown of what’s available and what’s in the pipeline. Let's take a look.
You can visit the new major facility dashboard here.
Understanding the Data
The facilities we're talking about are commonly called 'Safeguard facilities'—a regulatory term for Australia’s highest-emitting industrial sites. We refer to them simply as major facilities.
They’re regulated under the Safeguard Mechanism, a federal law that sets emissions limits—called baselines—for any site emitting more than 100,000 tonnes of CO₂-equivalent in a financial year.
Key metrics
At OnlyFacts you'll find a unique data page for each facility, showing the history of five key metrics:
- Gross emissions: Reported emissions before any credits are applied.
- Net emissions: Emissions after credits are factored in (net = gross – credits used + credits created).
- Baselines: The legislated emissions limit for each facility (electricity generators have a collective baseline).
- Credits+: Carbon credits created—usually Safeguard Mechanism Credits (SMCs) generated when a facility emits less than its baseline.
- Credits−: Carbon credits used—usually Australian Carbon Credit Units (ACCUs) surrendered when a facility exceeds its baseline.
Start with the full list of facilities—ordered by gross emissions—and click any name to drill into the data page.
What you can do with the data
Track facility baselines by headroom
Headroom is the difference between a facility’s permitted emissions and its actual emissions.
The facility with the largest headroom was Shell’s Floating Liquefied Natural Gas (FLNG) operation, offshore from Western Australia:
• Permitted emissions (baseline): 2,929,109 tonnes CO2 equivalent
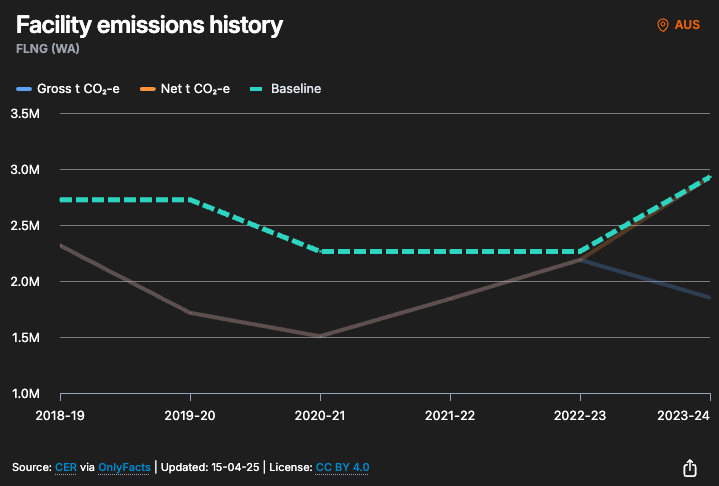
• Gross emissions: 1,851,848 tonnes
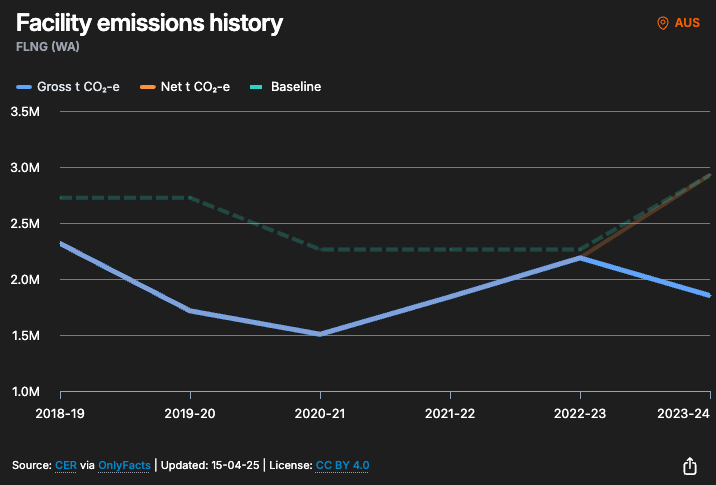
• Difference: 1,077,261
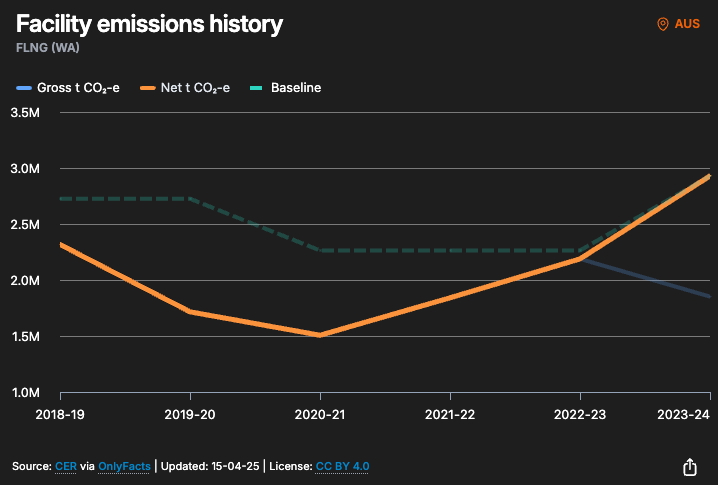
In this case, net emissions are higher than gross emissions because the facility was issued 1,077,261 Safeguard Mechanism Credits (SMCs) to bring it up to its baseline.
These credits can be sold to other facilities that exceed their limits or saved for future compliance.
Go to the list of facilities and baselines—ordered by headroom emissions. Again, you can click any name to drill into the data page.
Track Who’s Using the Most Credits
The reformed Safeguard Mechanism aims to drive down industrial emissions at the source. But facilities can meet their limits entirely by offsetting excess emissions with Australian Carbon Credit Units (ACCUs).
We’re tracking the facilities that rely most heavily on offsets to shrink net emissions. Facilities that use ACCUs equal to 30% or more of their baseline must issue a ‘please explain’, published by the Clean Energy Regulator here.
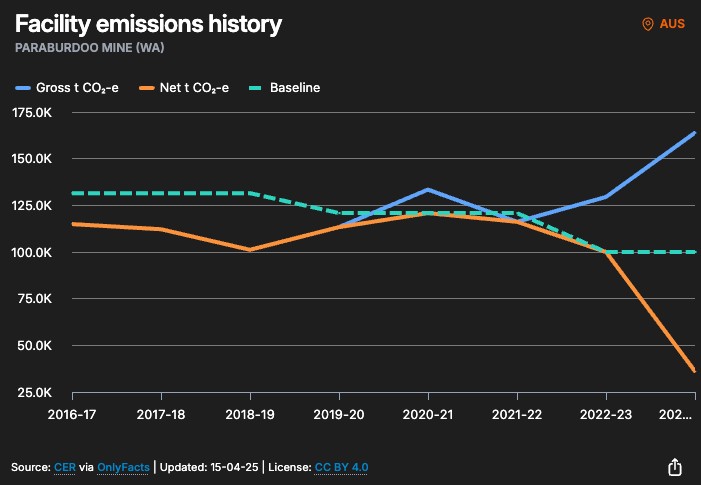
Who used the most credits in percentage terms? Paraburdoo Mine (WA), which is run by Hamersley Iron Pty Limited, a wholly owned subsidiary of Rio Tinto.
It used ACCUs equal to 78% of its gross emissions—far more than needed to meet its baseline.
- Permitted emissions (baseline): 100,000 tonnes
- Gross emissions: 163,892 tonnes
- Net emissions: 36,093 tonnes
- ACCUs surrendered: 127,799
- Reason given: Increased diesel use due to a higher work index—meaning tougher ore, larger operations, and longer hauls for diesel-powered equipment.
Notably, Paraburdoo surrendered more credits than necessary, pushing its net emissions well below its baseline.
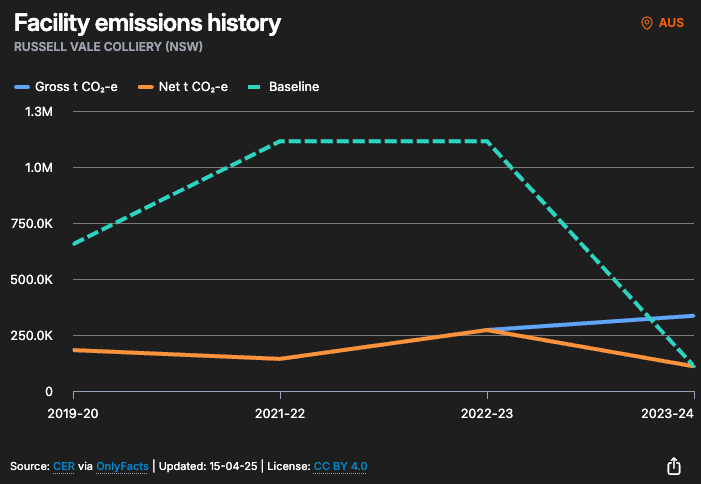
The next facility on the list was the trouble-plagued Russell Vale Colliery in NSW, owned by Wollongong Coal Limited. It surrendered ACCUs equal to 67.3% of its gross emissions.
- Permitted emissions (baseline): 110,000 tonnes
- Gross emissions: 335,908 tonnes
- Net emissions: 110,000 tonnes
- ACCUs surrendered: 225,908
- Reason given: Although Russell Vale Colliery stopped producing coal in January 2024, it remained in “care and maintenance”—a phase where active ventilation continues for safety. Ventilation keeps methane moving through the system, leading to significant methane emissions despite no coal production.
Go to the list of facilities and their credit use—ranked by reliance on offsets to achieve emissions reductions. Again, you can click any name to drill into the data page.
View all major facilities together—including electricity
Electricity is treated differently under the Safeguard Mechanism. Instead of individual baselines, all grid-connected generators share a single sectoral baseline—currently set at 198 million tonnes of CO₂-e, based on historical averages from 2009–10 to 2013–14.
The CER publishes electricity data separately. We’ve brought all major facilities—electricity and otherwise—into one view. You can also view the data aggregated at the company level. If you want to see the companies by individual industry, you can do that too via the dashboard. For example, here's the list of just electricity companies. We'll add views of facilities by industry soon.
Soon: Quick view of emissions trends
Soon, we’ll also add a quick view of year-on-year changes to help track shifts over time. These changes may reflect genuine emissions reductions—or simply new accounting methods. For example, this AFR article about Glencore’s Collinsville and Clermont mines shows how changes in methane measurement techniques 'scrambled' reported emissions.
We need your feedback. What do you think of this data. Is it useful? Confusing? What else would you like to see? We'd so appreciate you replying to this email to let us know.
What We’re Reading
Ahead of the federal election, experts respond to whether Coalition energy policies would lower power bills more than Labor’s. The Coalition is backing nuclear and gas, while Labor is focusing on grid upgrades, renewables, and home batteries. Both claim their plans are the path to cheaper energy. 'It's important to state that the factors most impacting energy bills are mostly outside the federal government's control,' says Tony Wood. 'Labor's policies are likely to deliver marginally lower prices than the Coalition's. Realistically, the impact will be lost in the noise.' (The Conversation)
Jive to Tropical Sundown while watching a time lapse of the NEM between Monday April 7 and Thursday April 10, captured in 5-minute intervals. A few days earlier, Queensland’s Callide C3 unit went offline unexpectedly, pulling 466 MW of generation out of the grid. The result: congestion and distorted market dynamics across QLD and NSW, as power flowed north to fill the gap. South of Sydney, prices turned negative as transmission lines hit their limit. Local price adjustments—red for negative, green for positive—flash across the map, revealing where electricity was suddenly worth more or less, prompting generators to ramp up or down. (WattClarity)
The UK’s Prudential Regulation Authority at the Bank of England instructed banks and insurers to review their climate risk. It found no British lender was able to fully quantify how climate change would affect their activities in different scenarios, and most considered the greatest risk to be ‘reputational’, not material. ‘Insurers had generally treated climate change more like a box-ticking exercise than a strategic risk, the PRA said, adding it had found “limited evidence that results are being used in decision-making”.’ (Financial Times)
Headlines To Watch
Australia
Why Labor won’t stop talking about nuclear power (Australian Financial Review, 2 May)
Unprecedented heatwave causes mass bleaching of Ningaloo, Kimberley reefs (WA Today, 2 May)
Victoria to legislate ‘first of its kind’ 2035 renewable gas target for industrial use (Renew Economy, 2 May)
Home battery sales crater as buyers wait on rebate (Australian Financial Review, 29 Apr)
Global
The mechanics behind Spain’s mega-blackout (Politico, 29 Apr)
ESG fund outflows hit record as sustainable investing backlash grows (Financial Times, 25 Apr)
State of the climate: 2025 close behind 2024 as the hottest start to a year (CarbonBrief, 24 Apr)
Data Update: Energy
The NEM in April 2025 vs April 2024
- 60.5% Fossil Fuels (-3.0%)
- 39.5% Renewables (+3.0%)
Breakdown
- 39.4% Coal (Black) (-3.2%)
- 15.2% Coal (Brown) (+0.8%)
- 13.2% Wind (+1.1%)
- 13.0% Solar (Rooftop) (+1.4%)
- 7.9% Solar (Utility) (+1.1%)
- 6.5% Gas (-0.5%)
- 5.7% Hydro (-0.5%)
Final Thought
(Revisited for Election eve)
'True terror is to wake up one morning and discover that your high school class is running the country.'
— Kurt Vonnegut
That's your climate data briefing. See you again very soon.
💛 Juliette and the OnlyFacts team
Make sense of data. Tell stories that matter. OnlyFacts Studio helps clients uncover, analyse, and share data that matters.