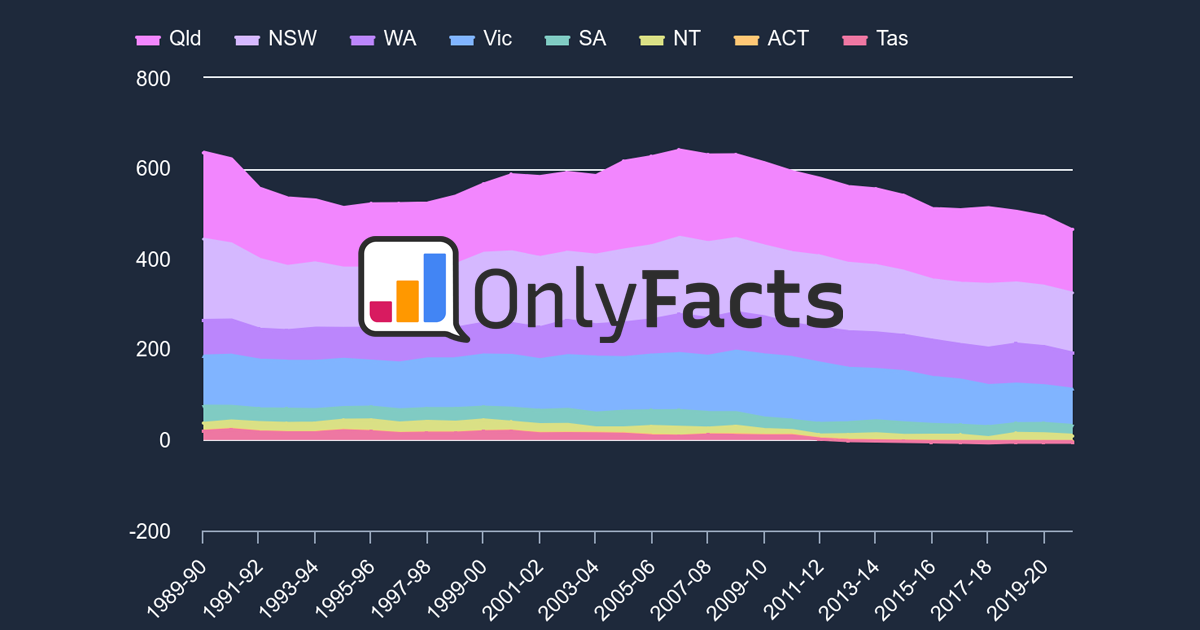
* Mt CO₂-e = Million Tonnes of Carbon Dioxide equivalent. Stationary energy = burning fuel for energy in settings other than transport.
Aus
Emissions History - Mt CO₂-e
Source: DCCEEW Quarterly updates via OnlyFacts | Updated: 01-09-24
Aus
Rolling 12 month total
YEAR |
Mt CO₂-e |
v PREV YEAR |
v 2005 |
---|---|---|---|
Jun 05 | 82.2 | - | 0 |
Sep 05 | 82.3 | - | 0.0% |
Dec 05 | 82.1 | - | 0.2% |
Mar 06 | 81.8 | - | 0.5% |
Jun 06 | 81.4 | 1.0% | 1.0% |
Sep 06 | 81.6 | 0.8% | 0.8% |
Dec 06 | 81.8 | 0.3% | 0.5% |
Mar 07 | 81.7 | 0.1% | 0.6% |
Jun 07 | 81.9 | 0.6% | 0.4% |
Sep 07 | 82.7 | 1.4% | 0.6% |
Dec 07 | 83.4 | 1.9% | 1.4% |
Mar 08 | 83.6 | 2.3% | 1.7% |
Jun 08 | 84.4 | 3.0% | 2.6% |
Sep 08 | 85.2 | 2.9% | 3.5% |
Dec 08 | 85.5 | 2.5% | 4.0% |
Mar 09 | 84.3 | 0.8% | 2.5% |
Jun 09 | 82.9 | 1.7% | 0.8% |
Sep 09 | 81.3 | 4.5% | 1.1% |
Dec 09 | 80.6 | 5.7% | 1.9% |
Mar 10 | 82.0 | 2.8% | 0.3% |
Jun 10 | 83.2 | 0.4% | 1.2% |
Sep 10 | 84.2 | 3.5% | 2.3% |
Dec 10 | 84.7 | 5.0% | 3.0% |
Mar 11 | 85.2 | 4.0% | 3.6% |
Jun 11 | 85.5 | 2.7% | 3.9% |
Sep 11 | 87.1 | 3.5% | 6.0% |
Dec 11 | 87.7 | 3.6% | 6.7% |
Mar 12 | 88.6 | 3.9% | 7.7% |
Jun 12 | 89.0 | 4.2% | 8.2% |
Sep 12 | 89.3 | 2.5% | 8.6% |
Dec 12 | 90.9 | 3.6% | 10.5% |
Mar 13 | 92.0 | 3.9% | 11.9% |
Jun 13 | 93.6 | 5.2% | 13.9% |
Sep 13 | 93.4 | 4.6% | 13.6% |
Dec 13 | 93.9 | 3.3% | 14.2% |
Mar 14 | 94.6 | 2.8% | 15.0% |
Jun 14 | 93.3 | 0.3% | 13.5% |
Sep 14 | 92.8 | 0.7% | 12.8% |
Dec 14 | 90.4 | 3.7% | 9.9% |
Mar 15 | 89.2 | 5.7% | 8.5% |
Jun 15 | 89.7 | 3.8% | 9.1% |
Sep 15 | 89.1 | 3.9% | 8.4% |
Dec 15 | 90.5 | 0.1% | 10.0% |
Mar 16 | 90.9 | 1.8% | 10.5% |
Jun 16 | 90.5 | 0.8% | 10.0% |
Sep 16 | 90.6 | 1.6% | 10.1% |
Dec 16 | 92.1 | 1.8% | 12.0% |
Mar 17 | 93.4 | 2.8% | 13.6% |
Jun 17 | 94.2 | 4.1% | 14.6% |
Sep 17 | 95.9 | 6.0% | 16.7% |
Dec 17 | 96.2 | 4.4% | 17.0% |
Mar 18 | 96.4 | 3.2% | 17.2% |
Jun 18 | 97.5 | 3.5% | 18.5% |
Sep 18 | 98.8 | 3.0% | 20.2% |
Dec 18 | 98.6 | 2.5% | 19.9% |
Mar 19 | 98.5 | 2.1% | 19.7% |
Jun 19 | 98.9 | 1.5% | 20.3% |
Sep 19 | 98.4 | 0.4% | 19.7% |
Dec 19 | 99.3 | 0.7% | 20.8% |
Mar 20 | 100.4 | 2.0% | 22.1% |
Jun 20 | 99.7 | 0.8% | 21.2% |
Sep 20 | 99.7 | 1.3% | 21.2% |
Dec 20 | 100.0 | 0.7% | 21.6% |
Mar 21 | 100.2 | 0.2% | 21.8% |
Jun 21 | 102.3 | 2.6% | 24.4% |
Sep 21 | 103.2 | 3.5% | 25.5% |
Dec 21 | 103.7 | 3.6% | 26.1% |
Mar 22 | 103.0 | 2.8% | 25.2% |
Jun 22 | 102.1 | 0.2% | 24.2% |
Sep 22 | 101.3 | 1.8% | 23.2% |
Dec 22 | 101.2 | 2.4% | 23.0% |
Mar 23 | 101.6 | 1.3% | 23.5% |
Jun 23 | 102.0 | 0.1% | 24.1% |
Sep 23 | 101.5 | 0.2% | 23.5% |
Dec 23 | 100.6 | 0.6% | 22.3% |
Mar 24 | 100.7 | 0.9% | 22.4% |
Jun 24 | 99.7 | 2.3% | 21.2% |
Source: DCCEEW Quarterly updates via OnlyFacts | Updated: 01-09-24
Never miss a beat
Get the free weekly climate briefing sent to your inbox, and you’ll never miss a data update or insight.