1. Emissions

  2. Sector

  3. Fugitive Emissions

  4. Data

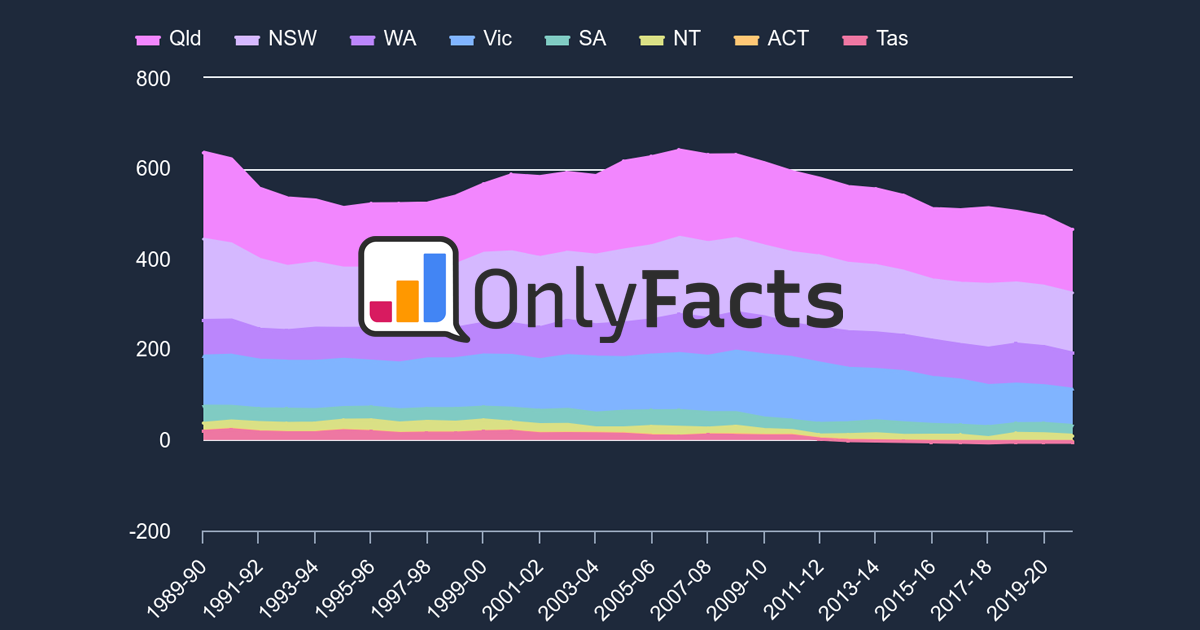
Fugitive emissions are released during gas, oil and coal production. When fossil fuels are extracted and produced, greenhouse gases are released into the atmosphere via deliberate releases (aka venting) or innumerable leaks in equipment. What is Mt CO₂-e? Emissions are a combination of gases. Most are Carbon Dioxide (CO₂). The other gases are measured as a Carbon Dioxide equivalent (CO₂-e) based on the amount of heat they trap in the atmosphere. They’re measured in Million Tonnes (Mt).

Fugitive Emissions emissions target

Emissions History - Mt CO₂-e

Australia

Data

Emissions History

Australia

YEAR

QUARTER

12 MTHS

Mt CO₂-e

NET

2004-05 Sep 2004 10.9 -
2004-05 Dec 2004 10.6 2.9%
2004-05 Mar 2005 10.5 1.4%
2004-05 Jun 2005 42.8 10.8 3.0%
2005-06 Sep 2005 43.0 11.1 3.4%
2005-06 Dec 2005 43.2 10.8 2.9%
2005-06 Mar 2006 43.4 10.7 1.2%
2005-06 Jun 2006 43.6 11.0 2.7%
2006-07 Sep 2006 44.4 12.0 8.8%
2006-07 Dec 2006 45.2 11.6 2.8%
2006-07 Mar 2007 46.0 11.4 1.6%
2006-07 Jun 2007 46.8 11.8 3.0%
2007-08 Sep 2007 46.7 11.8 0.5%
2007-08 Dec 2007 46.5 11.4 3.3%
2007-08 Mar 2008 46.3 11.2 2.1%
2007-08 Jun 2008 46.1 11.6 3.5%
2008-09 Sep 2008 46.0 11.7 1.2%
2008-09 Dec 2008 45.9 11.4 3.2%
2008-09 Mar 2009 45.8 11.2 1.8%
2008-09 Jun 2009 45.7 11.5 3.0%
2009-10 Sep 2009 45.7 11.7 1.4%
2009-10 Dec 2009 45.6 11.3 2.9%
2009-10 Mar 2010 45.6 11.1 2.0%
2009-10 Jun 2010 45.5 11.4 3.2%
2010-11 Sep 2010 45.1 11.2 2.0%
2010-11 Dec 2010 44.7 10.9 2.5%
2010-11 Mar 2011 44.4 10.8 1.6%
2010-11 Jun 2011 44.0 11.1 2.7%
2011-12 Sep 2011 44.1 11.3 2.7%
2011-12 Dec 2011 44.3 11.1 1.8%
2011-12 Mar 2012 44.5 11.0 1.2%
2011-12 Jun 2012 44.7 11.2 1.7%
2012-13 Sep 2012 44.9 11.5 3.1%
2012-13 Dec 2012 45.0 11.3 2.1%
2012-13 Mar 2013 45.2 11.2 0.9%
2012-13 Jun 2013 45.4 11.4 1.6%
2013-14 Sep 2013 44.9 11.0 3.2%
2013-14 Dec 2013 44.4 10.8 1.7%
2013-14 Mar 2014 44.0 10.7 0.8%
2013-14 Jun 2014 43.4 10.8 0.6%
2014-15 Sep 2014 44.7 12.4 14.6%
2014-15 Dec 2014 45.9 12.0 2.9%
2014-15 Mar 2015 47.2 12.0 0.5%
2014-15 Jun 2015 48.6 12.2 2.1%
2015-16 Sep 2015 48.8 12.6 3.3%
2015-16 Dec 2015 49.2 12.4 1.5%
2015-16 Mar 2016 49.6 12.3 0.9%
2015-16 Jun 2016 49.8 12.5 1.4%
2016-17 Sep 2016 50.6 13.4 7.4%
2016-17 Dec 2016 51.4 13.2 1.6%
2016-17 Mar 2017 51.4 12.4 6.3%
2016-17 Jun 2017 51.8 12.9 4.1%
2017-18 Sep 2017 52.8 14.4 11.9%
2017-18 Dec 2017 53.2 13.5 6.0%
2017-18 Mar 2018 54.2 13.3 1.5%
2017-18 Jun 2018 54.9 13.6 2.0%
2018-19 Sep 2018 55.0 14.5 6.8%
2018-19 Dec 2018 55.6 14.2 2.2%
2018-19 Mar 2019 55.8 13.5 5.1%
2018-19 Jun 2019 56.2 14.0 4.1%
2019-20 Sep 2019 55.5 13.8 1.7%
2019-20 Dec 2019 54.5 13.2 4.5%
2019-20 Mar 2020 54.3 13.3 1.0%
2019-20 Jun 2020 53.9 13.6 2.4%
2020-21 Sep 2020 52.7 12.7 7.0%
2020-21 Dec 2020 51.7 12.2 3.9%
2020-21 Mar 2021 50.3 11.9 2.4%
2020-21 Jun 2021 48.6 12.0 0.7%
2021-22 Sep 2021 48.6 12.6 5.2%
2021-22 Dec 2021 48.4 12.0 4.2%
2021-22 Mar 2022 48.1 11.6 4.0%
2021-22 Jun 2022 48.1 11.9 3.0%
2022-23 Sep 2022 47.9 12.4 3.8%
2022-23 Dec 2022 47.9 12.0 2.6%
2022-23 Mar 2023 48.0 11.7 3.0%
2022-23 Jun 2023 47.8 11.7 0.1%
2023-24 Sep 2023 47.2 11.8 0.8%
2023-24 Dec 2023 46.9 11.8 0.1%
2023-24 Mar 2024 46.9 11.7 0.2%

Related Items

News

Sign up to the free weekly climate data briefing