Mar 14, 2025
5 min read
🔋 Tracking Australia's Battery Power (Part 1)
On this page
Here’s something we can all agree on: sometimes, the wind doesn’t blow, and the sun doesn’t shine. As powerful and cheap as wind power and solar power might be, they are ‘variable’ or ‘intermittent’ sources of energy.
Intermittency is a pressing issue in the energy transition. Critics argue it makes renewables too unreliable to provide baseload power. The Coalition tends to dog whistle this by using the term ‘intermittent energy’ instead of ‘renewable energy’. (There are a few instances in this report to the nuclear energy inquiry).
The Australian Energy Market Operator (AEMO) says renewable energy that is firmed with storage and backed up by gas is the lowest-cost way to supply electricity to homes and businesses as Australia transitions to a net zero economy.
Let’s look at the most common and scalable storage technology: batteries.
Types of Batteries
There are a few different types of battery storage relevant to the energy transition.
- Utility-scale battery facilities (also know as big batteries) are connected to the grid.
- Smaller battery systems in homes (often paired with solar panels) are generally not connected to the grid, so are ‘behind the meter’.
- Car batteries in electric vehicles currently make up the lion’s share of the battery market (although BloombergNEF reports EV battery sales are slowing while stationary storage batteries are booming).
- Batteries in homes and EVs can work together as ‘virtual power plants’. More on that another time.
Batteries in the Grid
Let's start with utility-scale batteries. These big batteries interact with the electricity grid in two ways:
- First, they charge, which increases electricity demand
- Later, they discharge, which increases electricity supply
As more batteries connect to the system, their impact on both demand and supply grows.
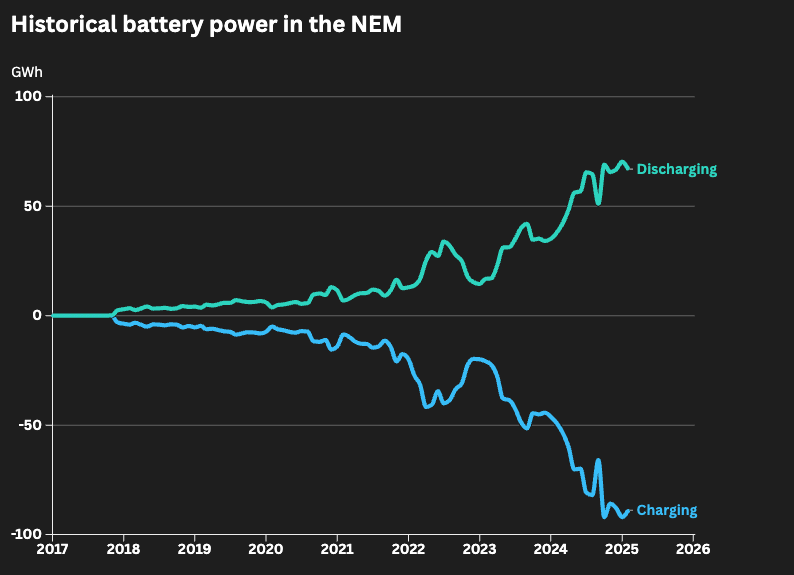
The chart below shows growth in battery activity in the National Electricity Market (NEM) since 2017. Last month, batteries:
- Used 88.86 GWh to charge
- Discharged 66.94 GWh back into the grid
For context, 66.94 GWh is enough to power nearly 116,000 households for a month (based on average daily electricity consumption per household of 19 kWh).
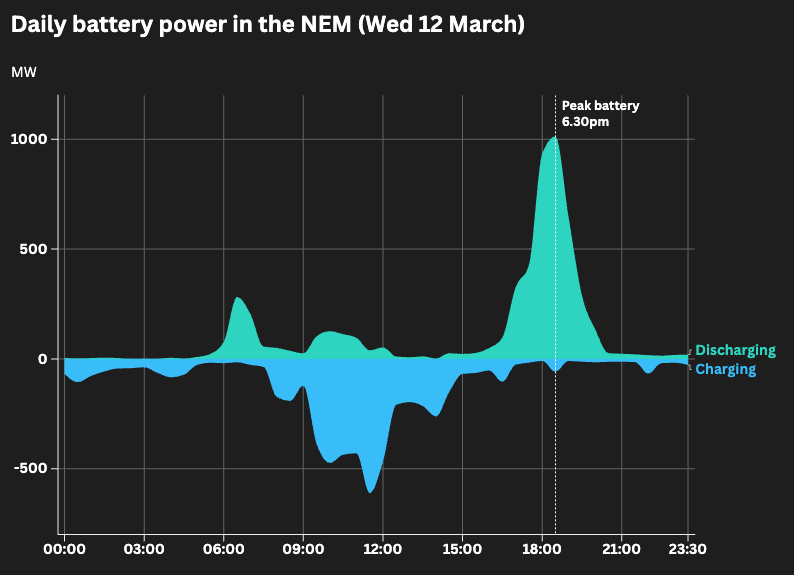
How Batteries Balance the Grid
The chart above shows how batteries both use and supply power. That's the point. They shift electricity demand from one period to another, reducing grid load during peak production and supplementing supply during peak demand. In other words, storage helps smooth the peaks and troughs.
This past week, the biggest day for batteries was Wednesday 12 March. Here’s a look at battery activity in the grid that day. Notice how batteries charged in the late morning and discharged in the early evening, peaking at 6:30 pm — when electricity demand is highest.
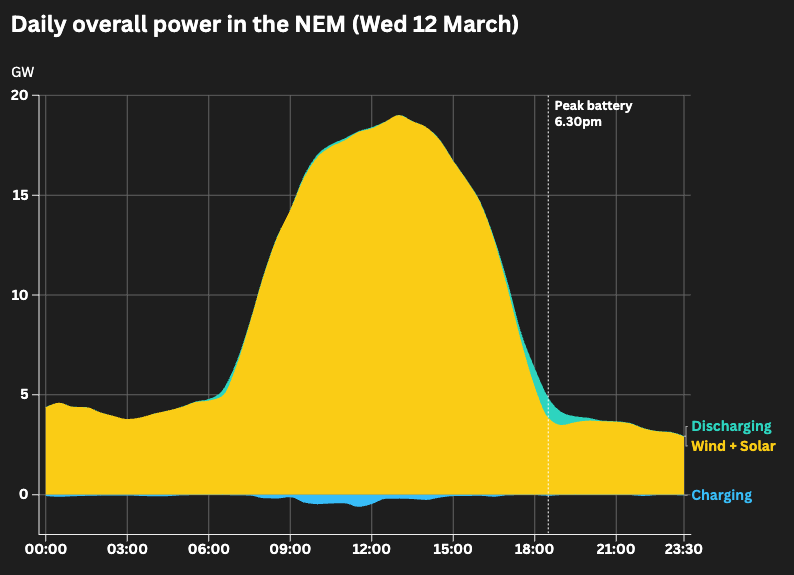
Let’s see how that smooths out the peaks and troughs left by renewables' variability. Here’s the same view, with solar and wind power added.
And here it is with the rest of the fuel sources in the NEM.
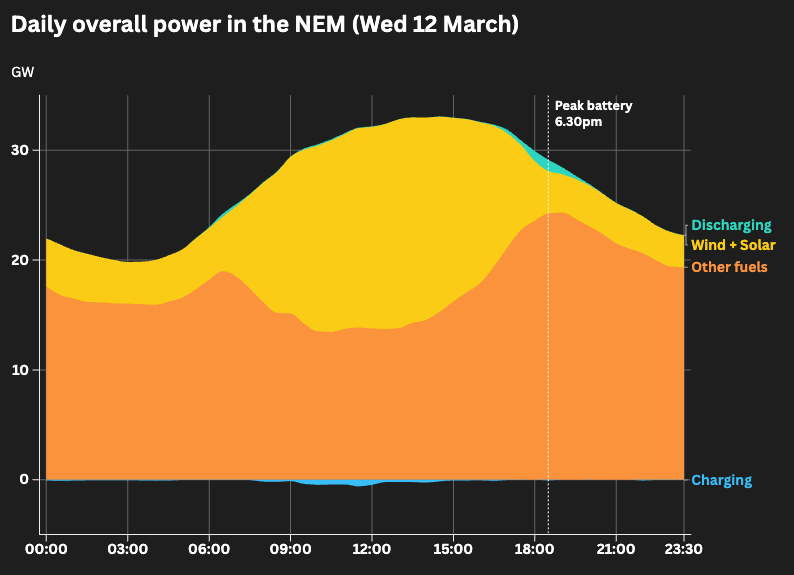
Cleary, battery power has a way to go to before it makes a real dent in the grid. But this is only one part of the battery equation — the big utility facilities connected to the NEM. In a future briefing, we’ll look behind the meter — at installations in homes and businesses. And none of this means much without context — what are the targets, and how do we compare globally? Stay tuned.
What We’re Reading
Clear explainer on what it means to ‘firm’ renewables in large power grids, which are ‘among the most complicated machines humans have ever devised.’ Short-term firming, lasting from a few seconds to a few hours, stabilises the grid by smoothing out spikes caused by changing weather. Long-term firming, lasting for hours, days or weeks, maintains power supply during extended periods of low renewable generation when it’s still, dark, and cold. ‘To firm renewables is to convert this cheap but variable source of power into what we really want: a reliable supply of electricity, there when we need it.’ (The Conversation)
Relevant article about the search for new storage solutions. Batteries are set to continue dominating the shorter storage market and pumped hydro can run for days. ‘What you need is stuff in the middle.’ In Port Augusta, a concentrated solar project uses thousands of mirrors to focus solar rays on receiver points, converting the energy into heat, which is later used to generate electricity. On the South Australia–NSW border, excess wind and solar energy is used to pump air into a deep underground cave, which is later released through turbines. (The Sydney Morning Herald)
Headlines to Watch
Australia:
- Households face up to 9pc power bill rise amid coal plant outages (Australian Financial Review, 13 Mar)
- Big batteries just hit a new record in Australia, but it’s a small fraction of the battery output in California (Renew Economy, 12 Mar)
- Forrest’s ammonia powered ship arrives for King’s sustainable markets initiative (The Australian, 9 Mar)
- Love your Tesla but can’t stand Musk? Sales data says you’re not alone (The Sydney Morning Herald, 6 Mar)
Global:
- Amazon, Google sign pledge to support tripling of nuclear energy capacity by 2050 (Reuters, 13 Mar)
- Europe’s biggest battery hope Northvolt files for bankruptcy in Sweden (Australian Financial Review, 13 Mar)
- Wind and solar overtake coal power for first time in U.S. (The Wall Street Journal, 12 Mar)
- More than half of world’s most populated cities are getting wetter, research finds (Financial Times, 12 Mar)
- Assessing the global climate in February 2025: Above-average temperatures over most areas; lowest global and Arctic sea ice extent (National Centers for Environmental Information, 12 Mar)
Data Updates
- Energy fuel mix this week in the National Electricity Market (NEM):
- Biggest day for renewables: 44.2% on Friday 7 March
- Coal (Black): 38.7%
- Coal (Brown): 13.9%
- Gas: 2.6%
- Solar (Rooftop): 13.7%
- Solar (Utility): 9.4%
- Wind: 17.8% 👀
- Hydro: 4.6%
- Bioenergy: 0.0%
- Biggest day for renewables: 44.2% on Friday 7 March
- Smallest day for renewables: 41.1% on Thursday 13 March
- Coal (Black): 41.6%
- Coal (Brown): 17.3%
- Gas: 4.6%
- Solar (Rooftop): 15.1%
- Solar (Utility): 9.0%
- Wind: 5.7% 👀
- Hydro: 7.3%
- Bioenergy: 0.1 %
Final Thought
'The most important bias in news media is not left or right. It’s a bias toward negativity and catastrophe.'
— Derek Thompson