Mar 21, 2025
4 min read
🔋 Tracking Australia's Battery Power (Part 2: Home Batteries)
On this page
Hi and welcome to your climate data briefing.
Last week, we explored battery power, focusing on utility-scale batteries linked to the National Electricity Market. Catch-up here.
But that’s only part of the story. Grid data misses smaller home battery systems — often paired with solar panels — that operate ‘behind the meter.’
Let’s dig into that.
Home Battery Uptake
Around 127,698 Australian homes and businesses have installed small-scale battery systems alongside solar panels (source: CER). Nearly half (48%) of these installations happened in the last two years. Here's the data to December:
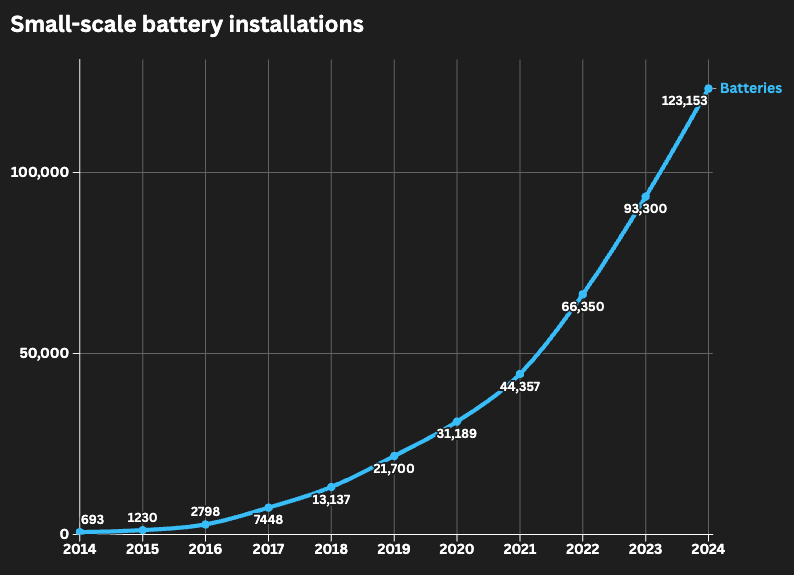
As always, there are a few caveats:
- The data only covers batteries installed alongside solar PV systems.
- Data collection began in 2014.
- It includes systems with valid renewable energy certificates, which can lag by up to a year.
Even so, the figures reveal a clear trend.
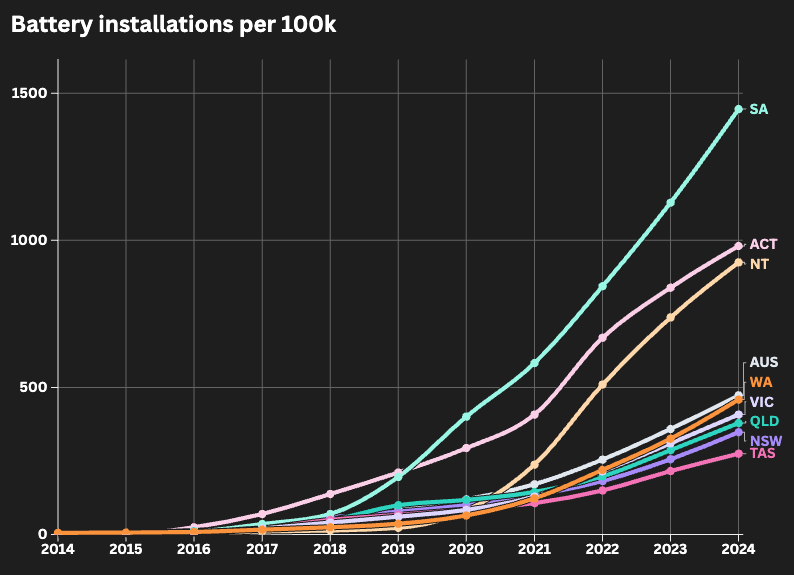
State Performance
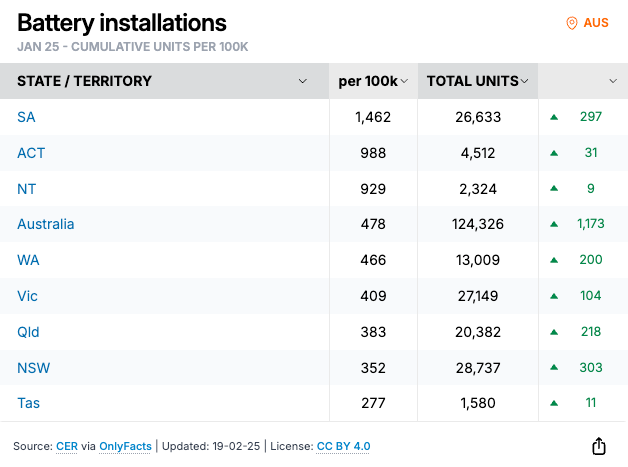
To compare states, let’s measure installations per 100,000 people. The national average sits at 478 installations per 100k.
- Above average: South Australia, ACT, and NT.
- Below average: WA, Victoria, Queensland, NSW, and Tasmania.
Battery vs Solar PV Uptake
Let’s compare battery installations with solar PV. The gap is massive. While more than 4 million Australian homes and businesses have installed solar PV, only around 127,698 have added a battery system. That’s just 3% of solar PV systems paired with a battery.

The biggest problem is cost. A Tesla Powerwall 2 from AGL will set you back around $12,000 — an impossible price for most households.
Some good news is BloombergNEF reported in December that lithium-ion battery pack prices have dropped sharply to $115 (USD) per Kilowatt-Hour.
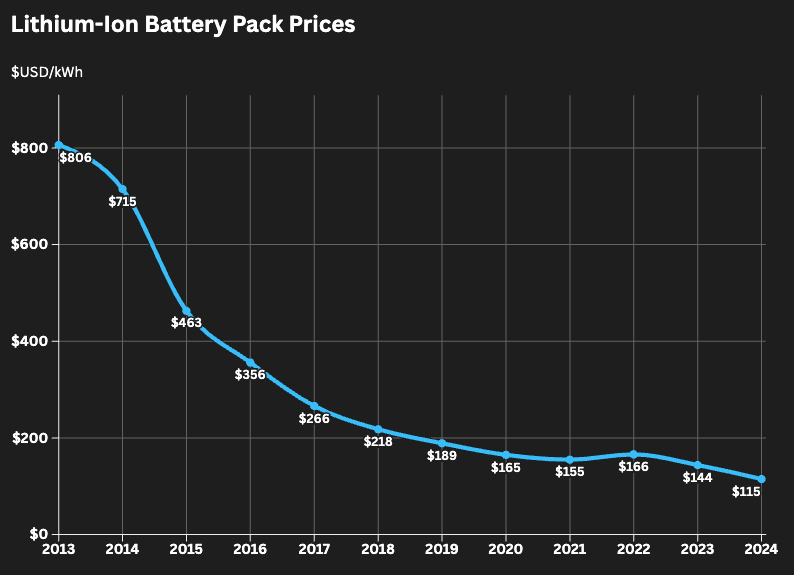
The report attributes the price drop to cell manufacturing overcapacity, economies of scale, lower metal and component costs, increased use of cheaper lithium-iron-phosphate (LFP) batteries, and a slowdown in EV sales.
But those savings haven’t reached Australian home storage systems yet. The figure reflects a global average across both EV and stationary storage markets. Plus, home batteries involve more than just a battery pack. Other components and smaller production scale keep the costs high.
We’re watching for signs of falling home battery prices in Australia. Let us know if you spot any. Until then, government incentives will have to do the heavy lifting.
What We’re Reading
Revealing report on BlackRock’s diplomacy tactics as it tries to dodge the greenlash. It’s been five years since CEO Larry Fink ‘extolled the virtues of a greener planet and displacing fossil fuels’ in his annual letters to investors. Today, the billionaire no longer utters the letters ESG. Last week, he was seen wearing a ‘Make Energy Great Again’ wristband at the Oil City USA energy conference in Houston. ‘From Indiana to Utah, West Virginia to Tennessee, BlackRock has dispatched emissaries to ingratiate itself with Republicans.’ (Bloomberg)
The paradox of patient urgency
Associate Professor in ecology reflects on the tension between ecological rhythms and human urgency. ‘As a scientist, the disconnect is jarring: the work I do often meticulously documents ecological change that unfolds over decades, while policies that could undo years of progress are being implemented overnight.’ How do we hold both urgency and patience simultaneously? The writer suggests collective, iterative progress. (Predirections)
Headlines to Watch
Australia:
- $800m pledge keeps Labor green hydrogen dream alive (Australian Financial Review, 20 Mar)
- Four new giant batteries to be built in W.A. as world’s biggest isolated grid navigates transition from coal (Renew Economy, 20 Mar)
- Victoria’s gas switch to cost households $5.8b: report (Australian Financial Review, 19 Mar)
- Active Super fined $10.5m for greenwashing (The Australian, 18 Mar)
- The maps that reveal how climate disasters are driving up insurance premiums in Sydney (The Sydney Morning Herald, 14 Mar)
Global:
- Greenpeace must pay at least $660m over Dakota pipeline protests, says jury (The Guardian, 20 Mar)
- BYD unveils EV battery that charges in just 5 minutes (Australian Financial Review, 18 Mar)
- Earth’s 10 Hottest Years on Record Are the Last 10 (The New York Times, 18 Mar)
Data Updates
Where our electricity came from (weekly averages)
- Coal (Black): 43.3%
- Coal (Brown): 14.1%
- Gas: 3.5%
- Solar (Rooftop): 11.0%
- Solar (Utility): 6.9%
- Wind: 17.3%
- Hydro: 5.0%
Summary
- Renewables: 40.7%
- Fossil Fuels: 59.3%
(Source: Open Electricity. Data reflects the National Electricity Market (NEM). Data based on 4/7 days in the last week).
Final Thought
'The past is another country. They do things differently there.'
— LP Hartley
That's your climate data briefing for this week. Hope you have a great Friday night and weekend. See you next week.
💛 Juliette and the OnlyFacts team