Feb 07, 2025
5 min read
😇 The Halo Effect Communities (Part 2)
On this page
Hi and welcome to your first climate data briefing for 2025.
Far from taking a break, we’ve been as busy as ever. 🐝 There's plenty to update you on in the coming weeks—with one piece of news at the end of this newsletter.
Cast your mind back to our final briefing last year, in which we saw solar and EV adoption follow opposite geographic trends: solar uptake rises as you move away from urban centres, while EV ownership increases closer to the city. But around the edges of capital cities, a 'halo' of communities has embraced both technologies.
Let's dig deeper.
Halo communities
OnlyFacts tracks and ranks postcodes for solar and EV adoption across Australia. Solar rankings are based on population, while EV rankings reflect the percentage of total vehicles.
Let’s look at the postcodes that rank in the top 1000 on both metrics—roughly the top half. Across Australia, 295 postcodes make the cut. Here's the national picture.

States that follow the halo pattern
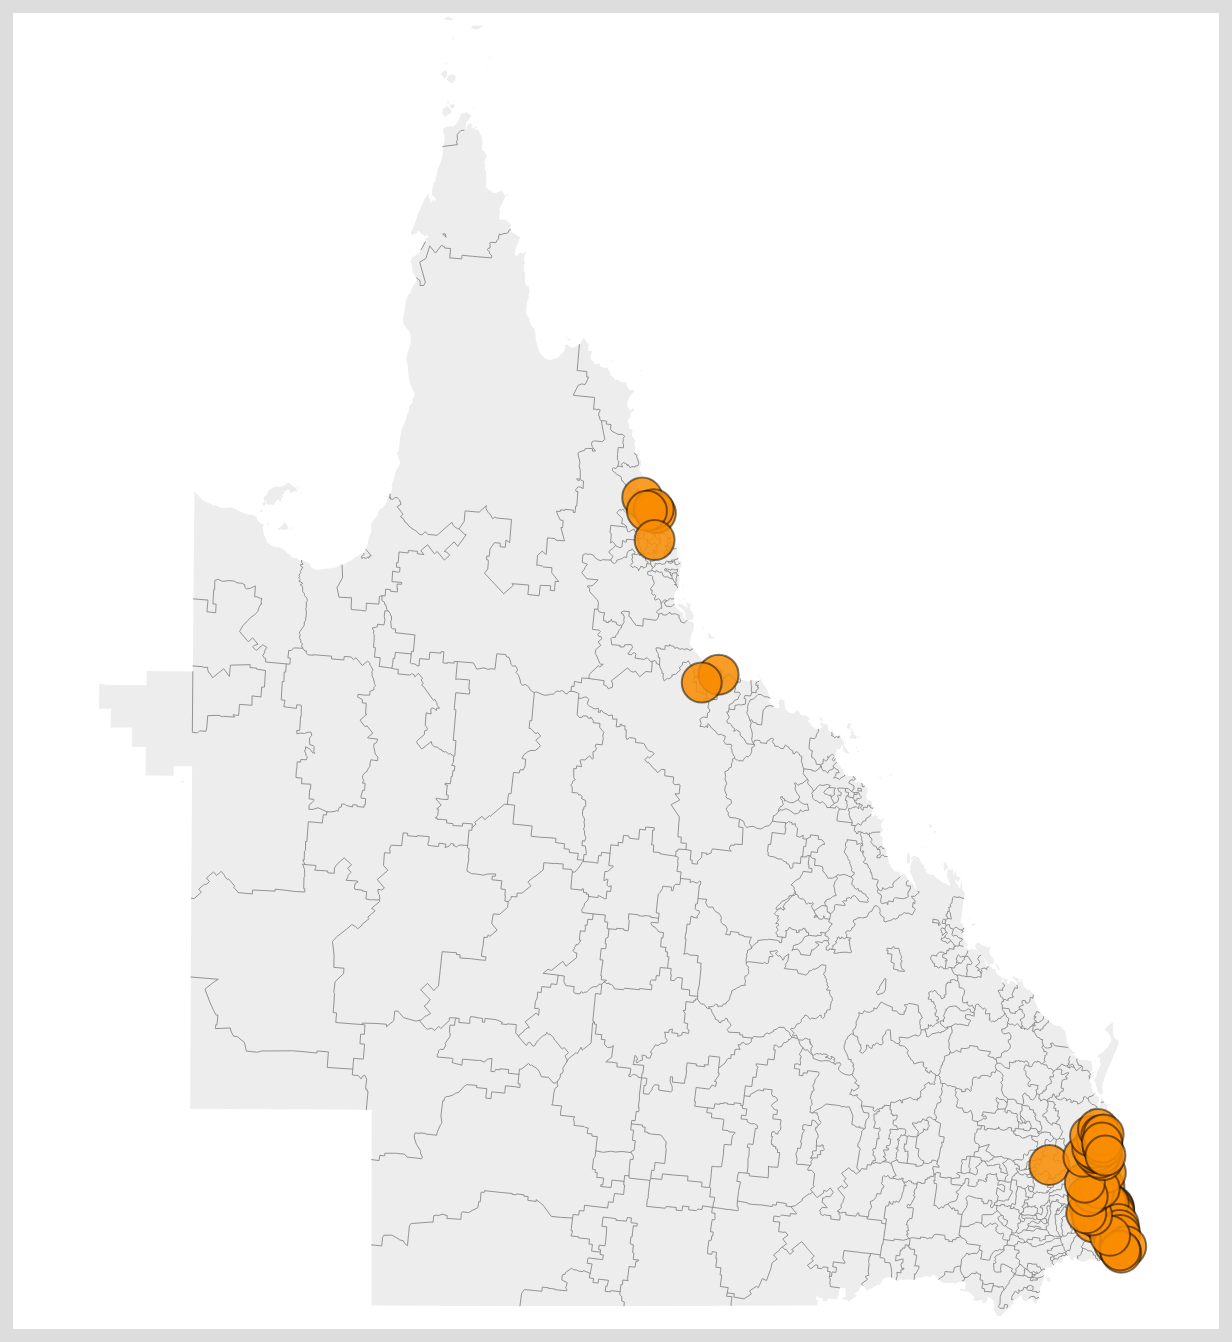
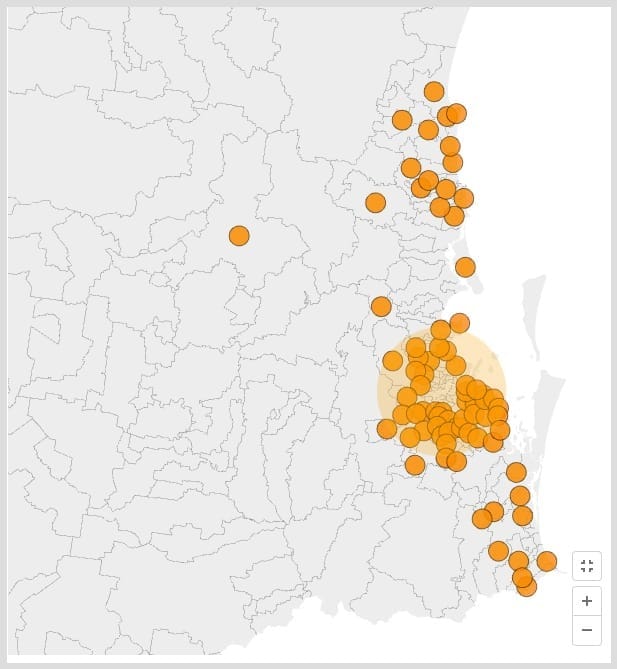
Queensland and South Australia are the undisputed leaders. In Queensland, 85 of the top 295 postcodes (29%) have strong adoption of both solar and EVs. Aside from a couple of clusters in the north, most form a ring around Brisbane and extend along the state's southeastern coast.
South Australia follows closely with 82 postcodes (28%) that align neatly with the halo pattern.


Western Australia follows with 41 postcodes (14%) in the top 295. Again, we can see a clear ring around Perth and tail along the coast.


The stragglers
Victoria and NSW do not follow the halo trend. Instead, their highest concentrations of solar and EVs combined cluster along the coast.
But the real standout issue? Australia’s two most populous states have the lowest number of communities strongly adopting both solar and EVs.
Victoria has just 38 postcodes (13%) in the top 295, despite being home to over a quarter of the national population.

NSW has a pitiful 17 postcodes among the top ranks for both solar and EV (6%), despite accounting for 31% of the population.

Granted, the top 1000 cut-off in each category is somewhat arbitrary, and rankings are inherently competitive. But it’s clear that communities around Greater Sydney and Greater Melbourne are lagging behind those in other capital cities. If boosting adoption is a priority, Sydney and Melbourne could brighten their halos.
New at OnlyFacts
To make this data more useful and allow analyses based on slightly larger areas that may be subject to different local council rules, we've crunched this postcode data into Local Government Areas (LGAs). As far as I can tell, OnlyFacts is the first to do this work and release the data freely and publicly. We certainly put in the work to translate them accurately. You can dig into solar data by LGA here and EV data by LGA here.
Data updates
New vehicle sales (January)
EV / PHEV: 5,740 (down 47.2% on previous month)
Hybrid: 14,836 (up 2.6%)
Petrol: 38,852 (down 7.4%)
Diesel: 25,372 (down 10%)
Renewables v Fossil Fuels (NEM, January)
56.3% fossil fuels
43.7% renewables
Electricity fuel sources (NEM Yesterday - 6 Feb)
Coal (Black): 38.0 %
Solar (Rooftop): 15.8 %
Coal (Brown): 13.9 %
Solar (Utility): 9.0 %
Gas: 8.6 %
Wind: 8.2 %
Hydro: 6.8 %
Bioenergy: 0.2 %
Small renewable installations (2024 total)
Solar PV: 295,529 units
Solar Water Heaters + Heat Pumps: 21,745 units
Carbon credits (FY 24/25 rolling total)
Credits issued: 11,124,267
What we're reading
In Italy, geothermal energy powers more than a third of Tuscany’s electricity needs. Yet globally, this fuel source generates just 16.3 gigawatts—less than 0.2% of total electricity capacity and only 1% of what solar PV produces. Experts say tapping just 0.1% of the Earth’s subterranean heat could meet global energy needs for the next two million years. But unlocking a geothermal revolution depends on solving a stubborn engineering challenge: how to drill deeper underground. (Noema)
An in-depth look at the history and failures of the Gorgon Carbon Capture and Storage (CCS) Project. In 2009, Chevron secured approval to develop the Gorgon and Jansz-Io gas fields off the coast of Western Australia. Fourteen percent of the extracted gas is carbon dioxide—a 'stunningly high' concentration. Under its approvals, Chevron was required to build a facility capable of capturing all the CO₂ removed from the field and to ensure at least 80% of that CO₂ was permanently stored. Over the past three years, less than one-third has been successfully captured. (Medium/Tim Baxter)
Week's headlines
Queensland power company fined $9m for ‘catastrophic failure’ after explosion and blackouts (The Guardian, 4 Feb)
Allan forced to release Victoria’s secret solar modelling (The Australian Financial Review, 4 Feb)
Beach CEO doubles down on gas strategy amid heightening Vic crisis (The Australian Financial Review, 6 Feb)
Italian and Japanese energy giants snap up landmark Australian wind, solar and battery assets (Renew Economy, 6 Feb)
Final thought
"Stewardship must be demonstrated, not simply announced"
— Parul Sehgal
That's your climate data briefing for this week. It's great to be back! This is going to be a big year. 💛 Juliette
ps. Think a friend would enjoy this briefing? We'd love for you to forward it and encourage them to sign up at this link.