May 16, 2025
7 min read
📉 The Shrinking Global Coal Market (Part 2: Coal Mines)
On this page
Hi! Welcome to your climate data briefing this Friday afternoon.
Today’s newsletter has been in the works for a couple of weeks.
Last month, we examined global trends in new coal-fired power plants. (Recap: new coal capacity has fallen to a 20-year low — catch up here.)
This time, we turn to the other half of the picture: coal mines.
Headline: While Australia may have stopped building new coal-fired power stations, we're still digging deep when it comes to coal mining.
Let’s take a look.
Coal Mines in Australia
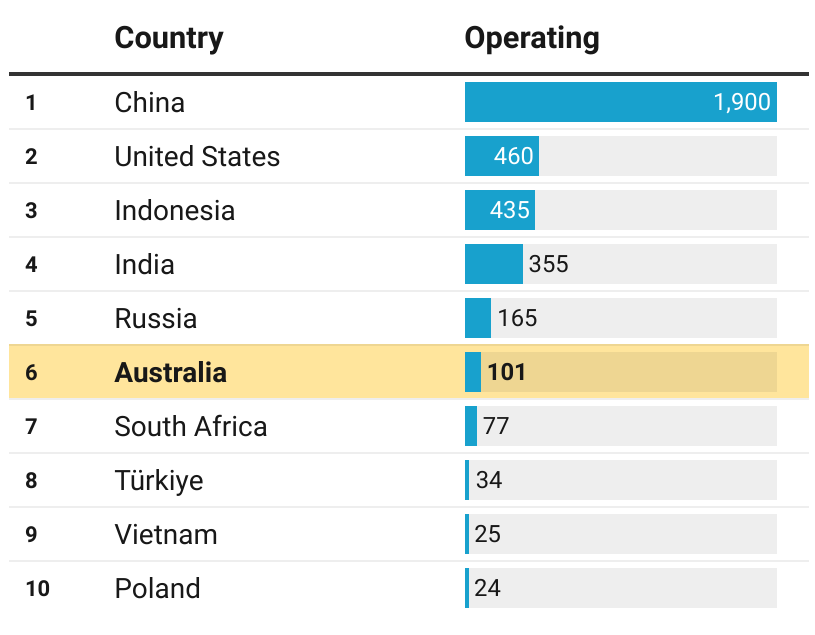
This is based on new data from Global Energy Monitor's Coal Mine Tracker.
(The ranks change slightly if we base them on known reserves, moving us up to 5th place for operating mines, but the reserves data is incomplete, so let’s stick with raw number of mines).
Here are the top 10 countries for number of coal mines in operation:
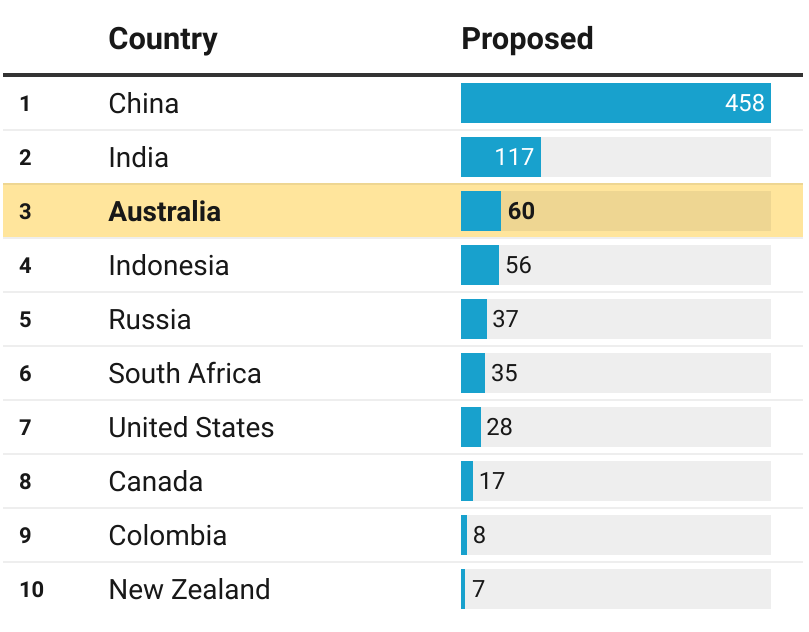
And here are the top 10 for proposed coal mines:
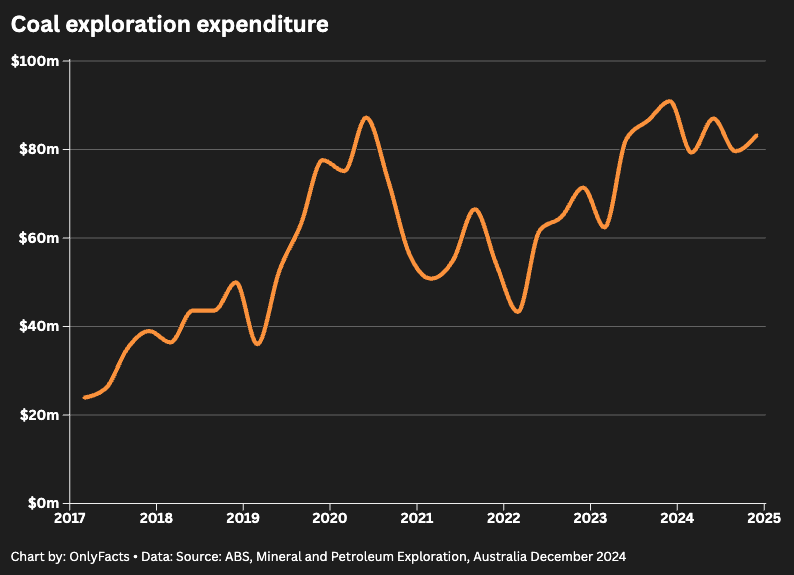
We can also look at the amount of money Australia is spending on coal exploration. The December quarter was among the highest yet.
The Places Aussie Coal Goes
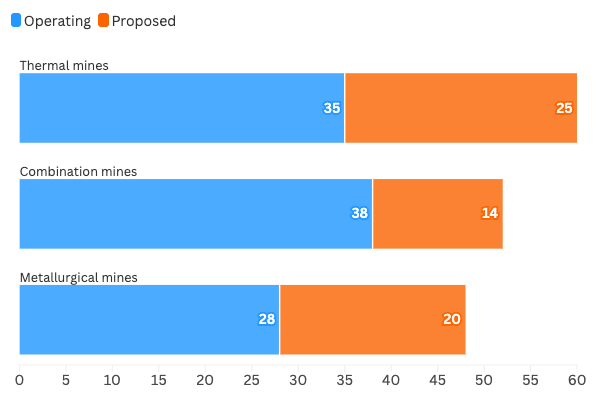
Let's look at each grade of coal separately. Australia produces two:
- Thermal coal – used to generate electricity
- Metallurgical coal – used in steelmaking
Our thermal coal mines outnumber metallurgical ones.
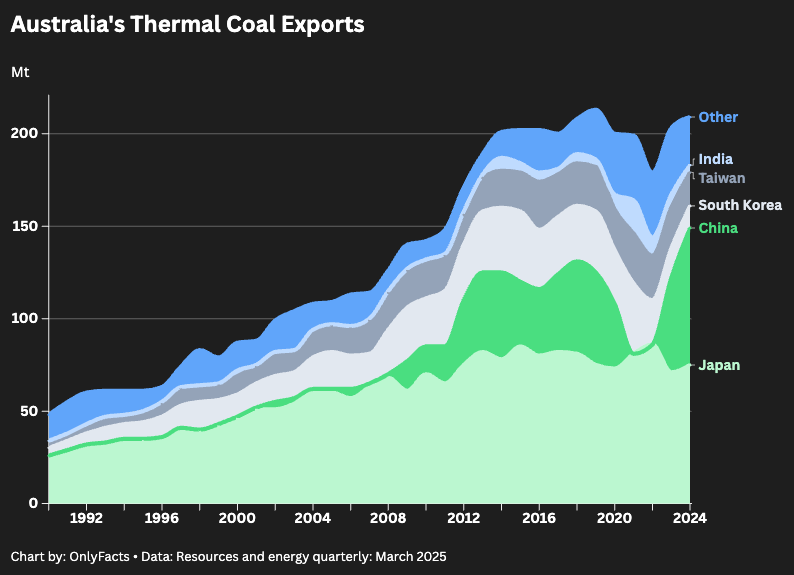
Thermal coal (for electricity)
- Australia is the world’s second-largest exporter of thermal coal, after Indonesia. It supplies 19% of global exports.
- Japan and China are our top buyers.
- Exports to China collapsed in 2021 after Beijing imposed trade restrictions—but they’ve since come back bigger than ever.
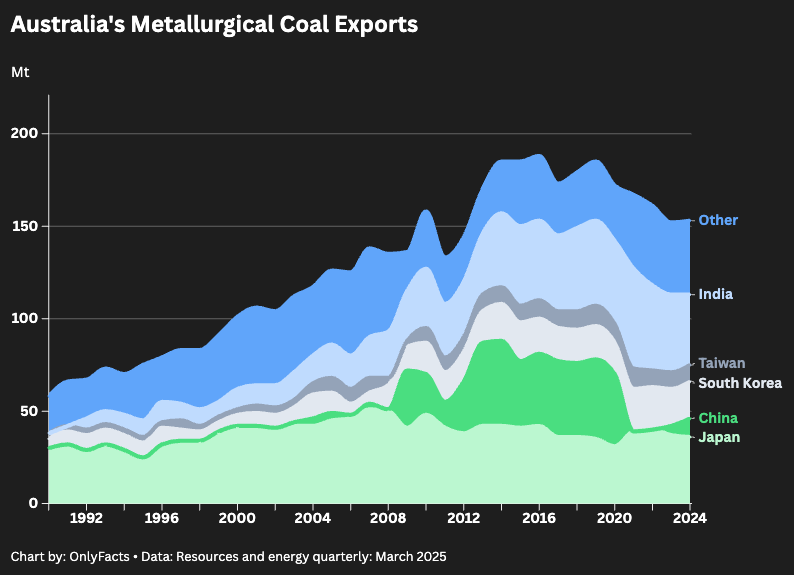
Metallurgical coal (for steel)
- Australia is the world’s largest exporter of metallurgical coal, supplying 46% of global exports.
- Japan and India are our biggest customers, followed by South Korea, Taiwan and China. Vietnam and Malaysia also import large amounts.
What’s Happening on the Other Side
Thermal coal
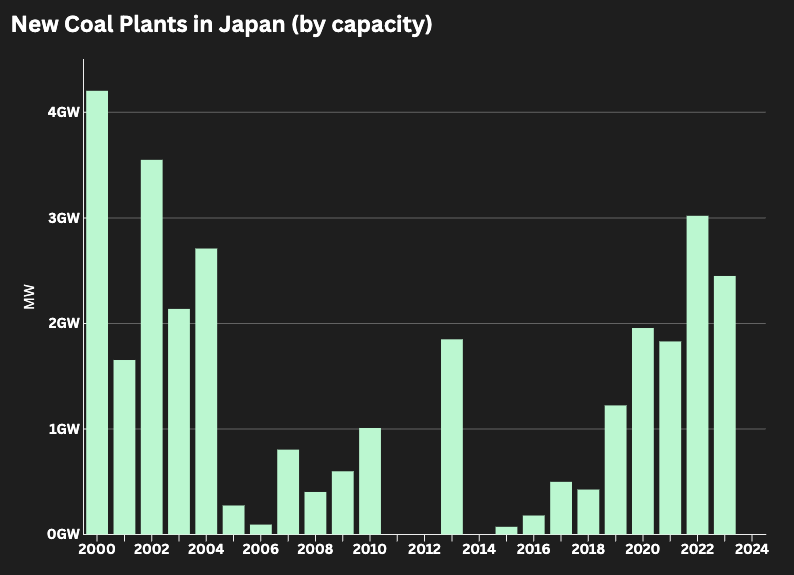
- Thermal coal is burned in power plants to generate electricity. But, as we saw in the previous briefing, the world is building fewer of them.
- Japan—Australia’s top customer—is one of the few exceptions. In 2022, it built more coal plants than in any year in the past two decades.
- Why? To shore up energy security after the 2011 Fukushima disaster destabilised the country’s electricity supply.
As for Australia’s other thermal coal customers, the Department of Industry, Science and Resources has issued warnings about tightening markets:
- China and India are trying to reduce reliance on imports.
- Vietnam, the Philippines and Bangladesh are under pressure to decarbonise.
Metallurgical coal
- Metallurgical coal is used in blast furnaces to produce steel.
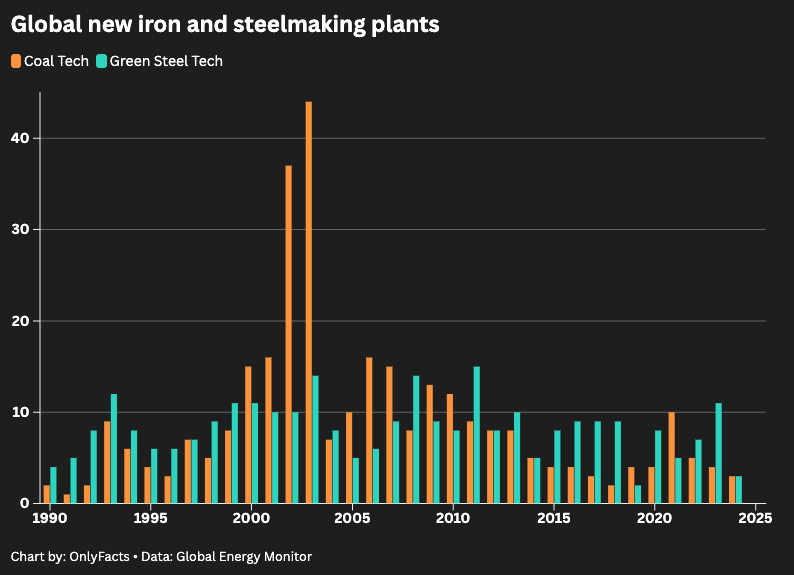
- Global Energy Monitor's iron and steel tracker shows new production plants are falling here too.
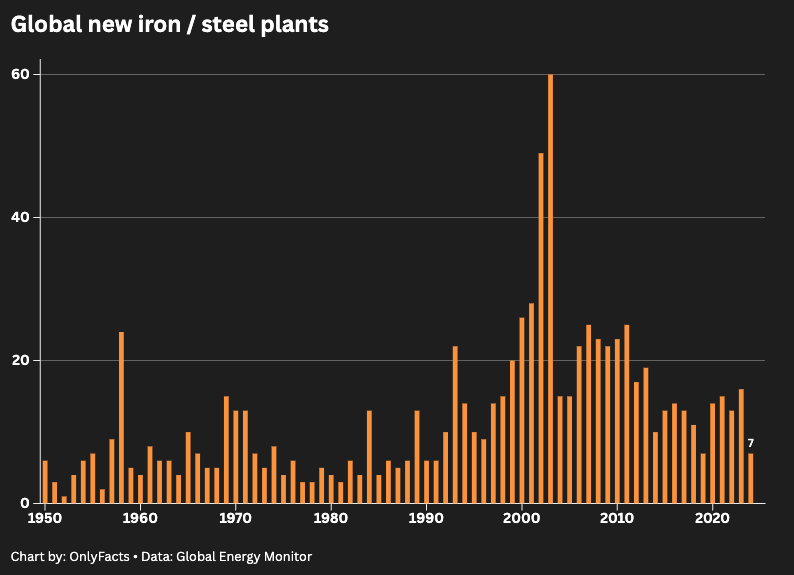
More importantly, most of the new iron and steel plants are geared toward green steel (electric arc furnaces and direct reduced iron, as opposed to blast furnaces) that don’t require metallurgical coal.
“Unlike iron ore, metallurgical coal cannot be used in any green steel pathway.” - Department of Industry, Science and Resources
Where is Australia’s metallurgical coal going?
- For years, we capitalised on industrialisation and urbanisation in China. But today, China’s steel production is slowing and the country is building more electric arc furnaces, rather than blast furnaces.
- So, Australia is looking to other markets where industrial and urban growth are driving demand — India and Southeast Asia.
- Even so, the Department of Industry, Science and Resources warns that the rise of low-emission steel production technology poses “a risk to the outlook of metallurgical coal exports.” EU metallurgical coal imports already “seem to be in a long-term structural downturn”.
Data Updates - Summary
Latest data updates at onlyfacts.io. Full details at the end of this newsletter.
What We're Reading
China’s energy system once ran on imported oil and coal. Xi Jinping saw it as a vulnerability. A decade and hundreds of billions of dollars later, China is the world’s front-running ‘electrostate’. The country is not only racing toward energy self-sufficiency, it ‘wields vast power over the markets for the resources and materials that underpin technologies of the future.’ It also gives Beijing a geopolitical edge. (Financial Times)
Researchers tested two charts illustrating winter warming in a fictional town. One showed rising average temperatures over time; the other showed whether or not a lake froze each year. Participants who saw the chart about lake freezing were more likely to perceive a greater impact from climate change. The conclusion? Presenting climate data through binary metrics, rather than continuous data, could solve the ‘boiling frog’ effect of apathy. (Nature / Springer)
Reflections on four decades as The Observer’s science editor, covering breakthroughs in DNA sequencing, the detection of gravitational waves, a communication technology revolution, and robots revealing the universe. Yet, the most striking story was a 1978 Nature paper that warned ‘rising fossil fuel use would drive atmospheric carbon dioxide to dangerous levels’. A recurring theme: ‘The rise of unreason has been the unwelcome partner to our growing scientific sophistication.’ (The Guardian)
Headlines to Watch
Australia:
Not as green as it seems: Parent group challenges energy giant over carbon claims (Renew Economy, 14 May)
From nuclear to nature laws, here’s where new Liberal leader Sussan Ley stands on 4 energy and environment flashpoints (The Conversation, 13 May)
Woodside overhauls Browse plan as environmental watchdog goes back to the public (WA Today, 12 May)
Gas companies ask for seat at the subsidy table (The Australian Financial Review, 12 May)
Companies ‘claim credit for keeping forests they never meant to clear’ (The Australian Financial Review, 11 May)
Global
Shell Faces Fresh Legal Challenge Over Development of New Oil and Gas Fields (The Wall Street Journal, 13 May)
Extreme weather and climate change impacts hit Africa hard (World Meteorological Organisation, 12 May)
Second-warmest April globally – Global temperature still more than 1.5°C above pre-industrial (Copernicus, 7 May)
Canada to Build $15 Billion Modular Nuclear Plant, First in G-7 (Bloomberg, 8 May)
U.S. Government to Stop Tracking the Costs of Extreme Weather (The New York Times, 8 May)
Real-world geoengineering experiments revealed by UK agency (The Guardian, 7 May)
Final Thought
'It’s not enough to be the first to see an inflection point, you have to actively accelerate the inflection.'
— Reid Hoffman
That’s your climate data briefing for this week. Don’t forget — data update details are below.
We’d love to hear what you think of the newsletter. Just hit reply and let us know.
See you again soon!
💛 Juliette and the OnlyFacts team
We back facts. If you do too, let’s work together. OnlyFacts Studio helps clients make sense of data and tell stories that matter.
Data Updates - Details
Latest data updates at onlyfacts.io.
🚗 ELECTRIC VEHICLES (NATIONAL)
New car sales (April ’25 vs April ‘24)
Source: FCAI
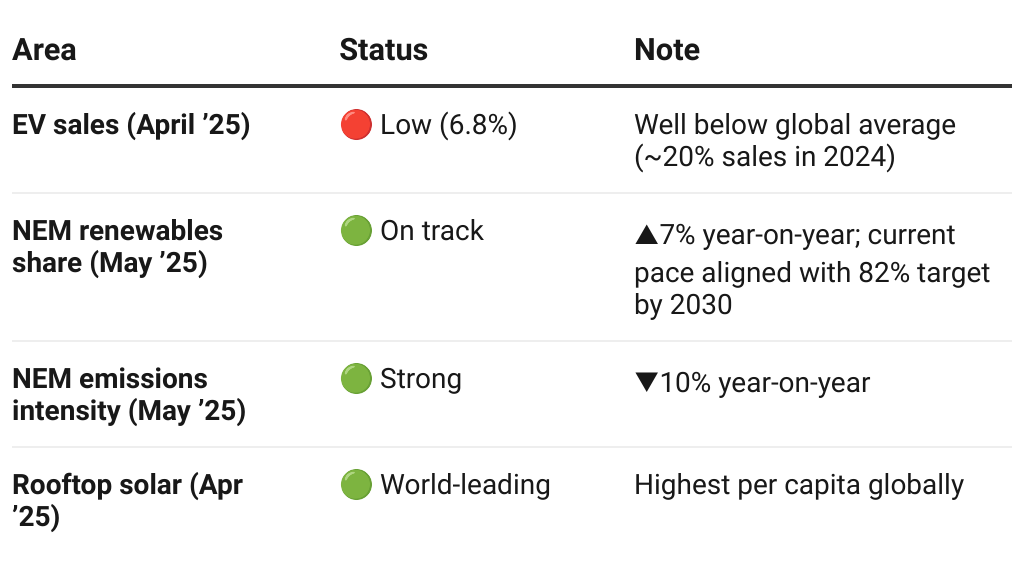
- EV: 6.8% (▲ from 6.7%)
- PHEV: 3.0% (▲ from 1.4%)
- Hybrid: 16.3% (▼ from 17.7%)
- Petrol: 41.4% (▼ from 43.7%)
- Diesel: 32.6% (▲ from 30.5%)
Comment: EV sales well below global average in 2024 (20%).
⚡ ELECTRICITY MIX – NEM (NSW, VIC, QLD, SA, TAS, ACT)
Source: Open Electricity
Share of generation (May ‘25 vs. May ‘24)
- Renewables: 39% (▲ 7%)
- Rooftop solar: 11% (▲ 2%)
- Wind: 15% (▲ 3%)
- Utility solar: 7% (▲ 2%)
- Hydro: 6% (▼ 0.3%)
- Fossil fuels: 61% (▼ 7%)
- Black coal: 41% (▼ 4%)
- Gas: 6.8% (▼ 3%)
- Brown coal: 14% (▼ 1%)
Emissions intensity: ▼ 10% year-on-year
Record: Highest ever battery discharge (1,509 MW on 15 May 6:00pm) via Open Electricity
Comment: Renewables have supplied 7% more of the NEM than in May last year, driven by growth across rooftop solar, utility solar, and wind. If this pace holds, the 82% target by 2030 is within reach.
☀️ RENEWABLES DEPLOYMENT (NATIONAL)
Rooftop solar installations (April '25)
Source: CER
- National total: 4,089,303 (+12,374 in April)
- Per capita: 15,720 per 100,000 people (Includes new installations, additions, extensions and replacements)
📍 State leaderboard – installations per 100,000 people
Green is above national average; Red is below.
- South Australia – 23,439
- Queensland – 20,756
- Western Australia – 19,159
- National average – 15,720
- New South Wales – 13,215
- Victoria – 12,218
- ACT – 10,840
- Tasmania – 10,538
- Northern Territory – 9,709
📍 Top LGAs – installations per 10,000 people:
- Yorke Peninsula, SA
- Yankalilla, SA
- Queenscliffe, VIC
- Orroroo Carrieton, SA
- Barunga West, SA
📍 Top Postcodes – installations per 10,000 people:
- 5581 (Port Vincent+, SA)
- 5320 (Morgan+, SA)
- 3221 (Anakie+, VIC)
- 5583 (Edithburgh+, SA)
- 5582 (Stansbury+, SA)
One suburb listed; “+” indicates there are additional localities within the postcode.
Comment: Australia is a world-leader in rooftop solar, generating more solar energy per capita than any other country (Ember via Renew Economy).
This briefing was produced by the team of data journalists, analysts and engineers at OnlyFacts. We're a nonpartisan fact tank dedicated to raising Australia’s collective IQ on big issues by making data more accessible. We encourage you to reuse our data, charts and ideas. Here's how.