Feb 28, 2025
5 min read
🚨 Emissions Data Update + Introducing OnlyFacts v3
On this page
Hi, and welcome to your climate data briefing.
We love a data-filled Friday, and today definitely delivered.
This afternoon, the government published Australia’s latest quarterly emissions update, showing a 0.3% rise in net emissions for the year to December 2024. But before reading too much into that, consider the details below.
Earlier, the Clean Energy Regulator released a year’s worth of corporate emissions data. We’ll dive into that in next week’s briefing.
Meanwhile, we’ve launched the latest version of onlyfacts.io—our third major upgrade, shaped by your feedback and packed with improvements. A few key features are outlined below, and we’d love to hear what you think.
Emissions Update
Here’s what today’s quarterly emissions update tells us:
December 2024
- Greenhouse gas emissions for the year from December 2023 to December 2024 were 436 Mt CO₂-e—0.3% higher than the previous year.
- These figures are preliminary estimates. When final estimates are published in three months, they will likely be revised down slightly. The update notes that anticipated reductions from the Santos Moomba Carbon Capture and Storage project haven’t been factored in yet.
September 2024
Today’s update also revised emissions estimates for the previous quarter (Sept 2023 – Sept 2024):
- Preliminary estimate: 441 Mt CO₂-e (+0.3% compared to the previous year).
- Finalised estimate: 434.9 Mt CO₂-e (-0.5% compared to the previous year).
The final figure shows a downward revision, highlighting the importance of waiting for updated data.
Longer-Term Trends
Don’t get too caught up in the small differences between preliminary and final estimates. The bigger picture matters more: emissions have flatlined, and Australia remains well off-track to meet its targets.
Here's a rundown:
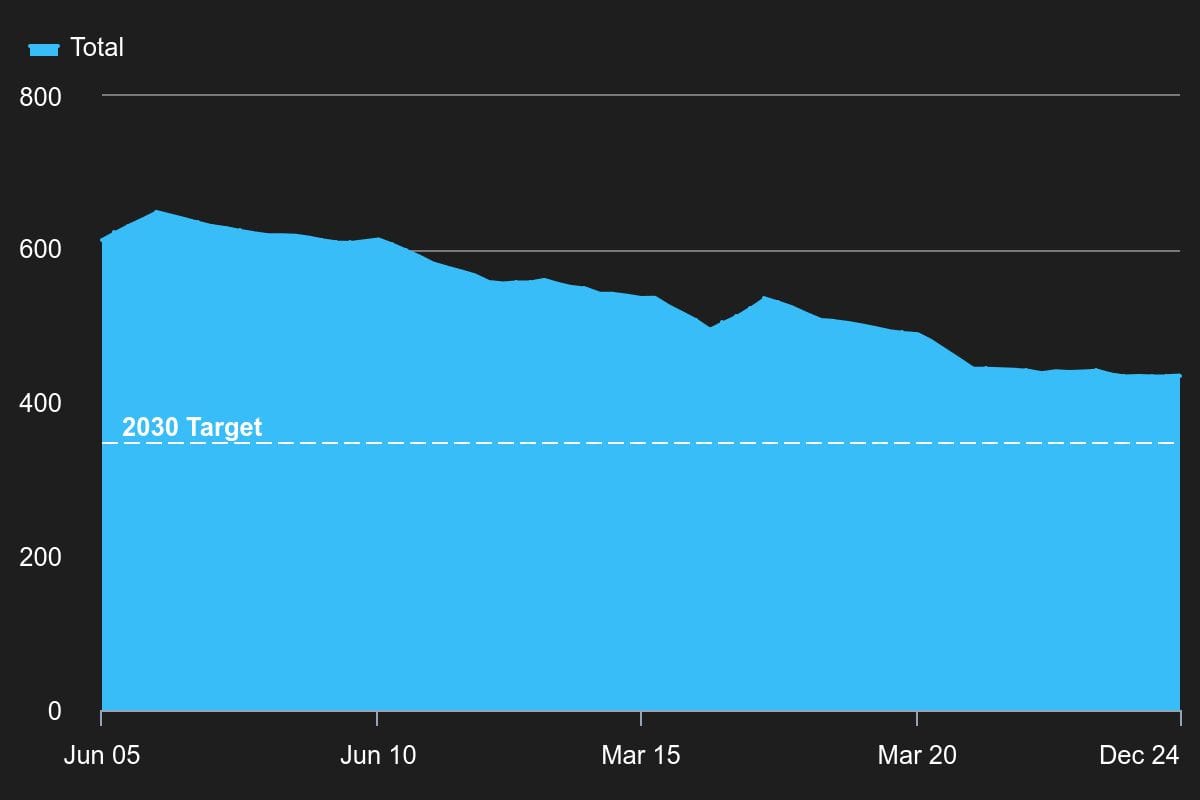
- Emissions target: -43% v 2005 (348.9 Mt CO2-e / year)
- Current progress: -29% v 2005 (435.8)
- Needed pace of reductions: -2.8% per year (-17.4)
- Current pace of reductions: +0.2% per year (+1.2)
Australia's net emissions versus 2030 target:
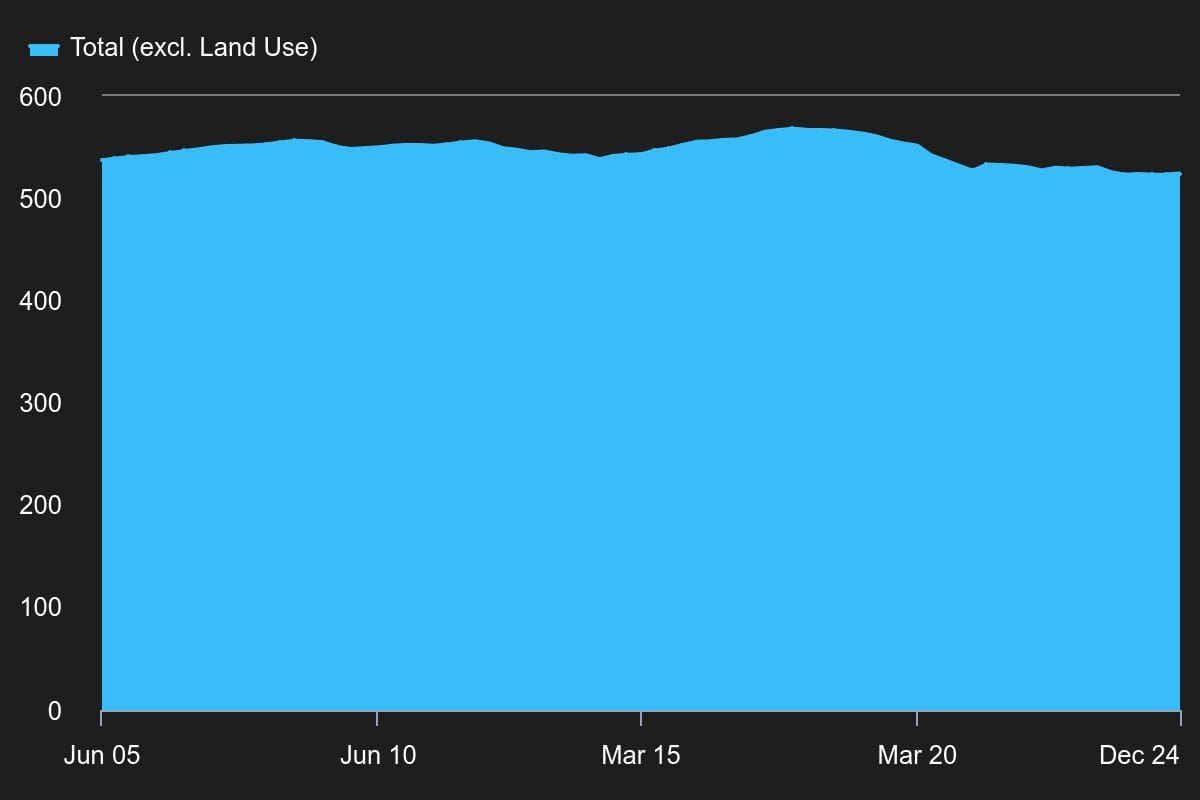
Australia's gross emissions (excluding the Land Use sector):
Sector-by-Sector Breakdown
Beyond the overall numbers, the sector-by-sector trends tell an important story. We’ll dig into this in a future briefing, but here’s a quick summary from today’s update:
Sectors where emissions increased:
- Electricity +1.7%
- Fugitive Emissions +1.5%
- Transport +1.5%
Sectors where emissions fell:
- Agriculture -1.7%
- Industrial Processes -4.1%
- Stationary Energy -1.3%
Sectors where emissions remained stable:
- Waste
- Land Use
Introducing OnlyFacts v3
We follow the Lean Startup methodology—build, measure, learn, iterate—which means the onlyfacts website is always evolving.
What’s New in v3?
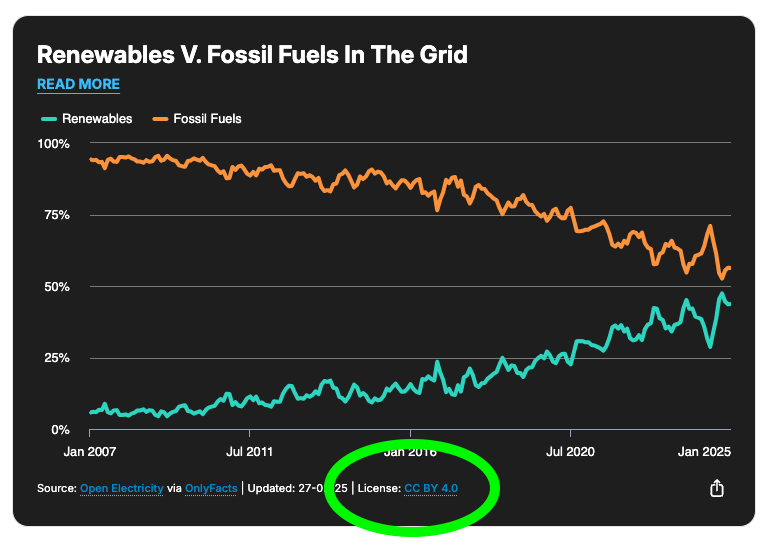
- New homepage layout with a feature chart and an improved onboarding experience for our verticals.
- The current feature chart tracks renewables and fossil fuels in the national electricity market. Read more here.
- Clearer guides on licensing and how you can use our data and charts. Read more here. Look for CC BY 4.0, which means you can use our charts and data for any use—commercial or non-commerical—as long as you credit and link to us.
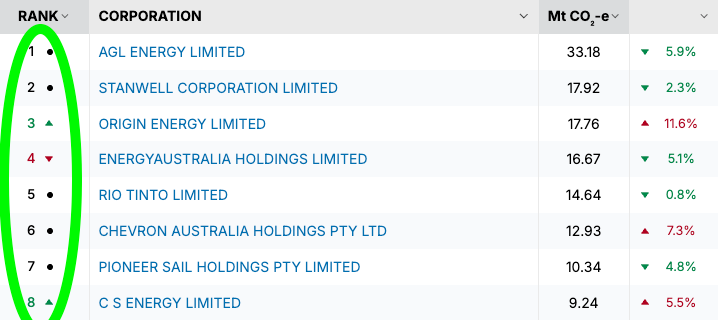
- Improved rankings display so you can track whether communities and companies are moving up or down the scoreboard.
What We’re Listening To
Interview with energy analyst Nat Bullard, whose annual slide decks are a bible of data points clarifying the state of decarbonisation. Bullard’s latest deck shows mentions of ESG in corporate earnings calls are down 60 percent on what they were in 2021-22. Derek Thompsons asks if it is just a rhetorical bubble that has popped, or something more material. ‘While BlackRock's mentions of ESG … have really plummeted, its sustainable assets under management are a trillion dollars. They have not gone anywhere,’ says Bullard. (Plain English with Derek Thompson)
What's more important for the climate: what you eat or where it comes from? A Toronto Star journalist asks environmental scientist Jonathan Foley for shorthand rules to reduce emissions when buying groceries. ‘It turns out food miles aren't really a big factor in greenhouse gas emissions,’ Foley says. Most of the emissions in the food system come from growing the food, not transporting the food. The three big questions to ask are: Is it a cow? Was it from a rainforest? Did they over-fertilise the soils? (Small things Big Climate)
Headlines To Watch
- Coalition pledges to scrap Southern Offshore Wind Zone (Renew Economy, 26 Feb)
- BP abandons pledge to cut oil and gas output as boss fights for group’s survival (Australian Financial Review, 25 Feb)
- Australia’s main grid sets new solar output record (Renew Economy, 24 Feb)
- Glaciers estimated to have lost 5% of ice globally since 2000 (Nature, 19 Feb)
Data Updates
- Solar PV: 10,190 units in Jan 2025 (-51% versus Jan 2024)
- Solar water heaters: 426 units in Jan 2025 (-71% versus Jan 2024)
- Air source heat pumps: 1,830 units in Jan 2025 (-76% versus Jan 2024)
Solar PV by postcode
Who moved up the scoreboard?
Find your postcode here: Solar PV | Solar water heaters | Air source heat pumps
Energy fuel mix
In the National Electricity Market (NEM).
- Biggest day for renewables this week: 47.6% on Saturday 22 Feb
- Smallest day for renewables this week: 39.7% on Thursday 27 Feb
- Yesterday’s breakdown:
- Coal (Black) 40.5%
- Solar (Rooftop) 16.1%
- Coal (Brown) 14.3%
- Solar (Utility) 10.5%
- Hydro 7.0%
- Wind 6.2%
- Gas 5.9%
- Bioenergy 0.1%
Final Thought
Tell me what you eat and I will tell you who you are.
— Jean Anthelme Brillat-Savarin
That's your climate data briefing for this week. We'd love to hear your feedback, if you have any. Thanks for reading and see you again soon.
💛 Juliette and the OnlyFacts team.