Mar 07, 2025
7 min read
🏙️ Corporate Emissions Update: Biggest Rises and Falls
On this page
Last week, we published fresh data about greenhouse gas emissions from Australia's biggest companies.
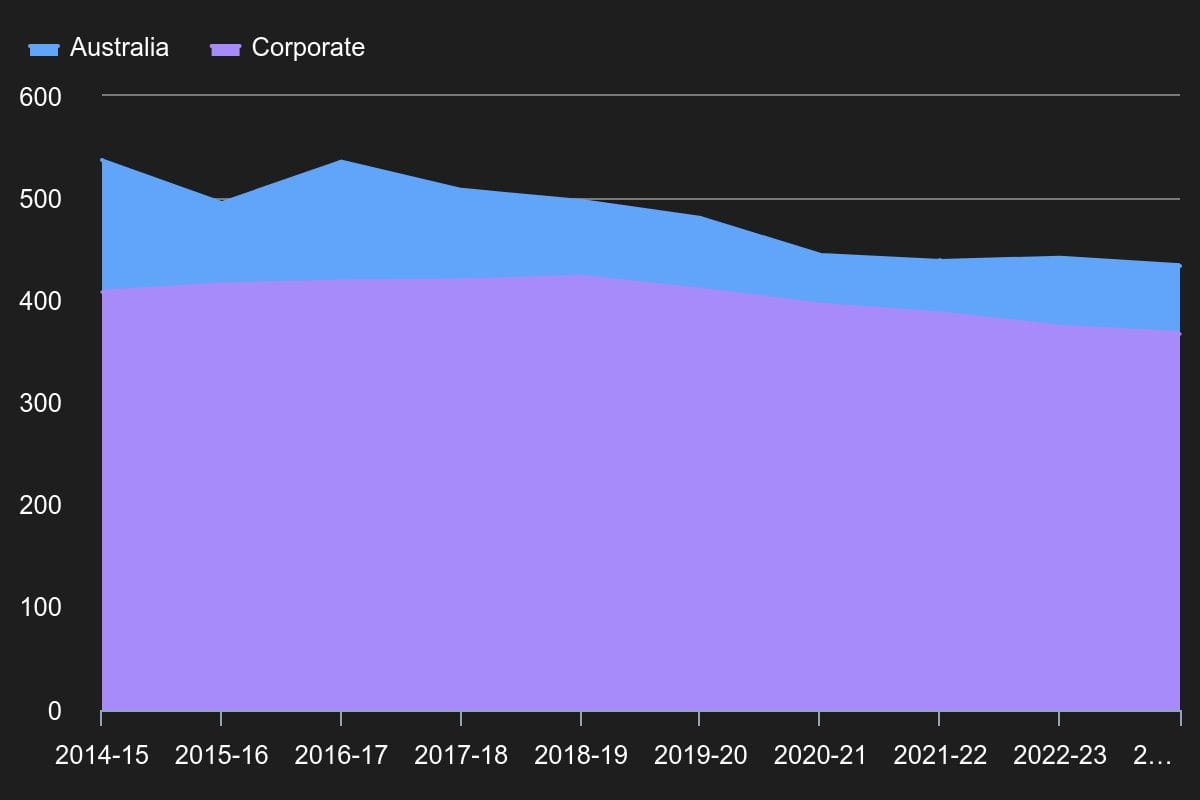
Why it matters: Corporate emissions make up about 85% of Australia’s net total. Here’s how they compared in the last financial year (2023-24).
- Australia's corporate emissions: 368.3 Mt CO₂-e (-1.6% vs 2023)
- Australia's total net emissions: 434.6 Mt CO₂-e (-1.7% vs 2023)
The takeaway? Corporate emissions are effectively Australia’s emissions as seen through corporate operations, underscoring the role of businesses in driving reductions.
This briefing gives you some corporate top 10 lists:
- 10 Biggest Emitters: What's changed?
- 10 Biggest Falls: Which companies reported reductions?
- 10 Biggest Rises: Which companies reported hikes?
Let's dive in.
Primer: About This Data
Before we get started, here are a few things to know about this data.
- Where does it come from? The Clean Energy Regulator (CER), which administers the National Greenhouse and Energy Reporting (NGER) Scheme, which requires certain companies to report their greenhouse gas emissions.
- Which companies? Those exceeding thresholds set by the NGER Act: facilities emitting ≥25 kt CO₂-e or using ≥100 TJ of energy, and corporate groups emitting ≥50 kt CO₂-e or using ≥200 TJ. The latest release covers 392 companies.
- What do they have to report? Scope 1 and 2 emissions, which means those directly produced by companies and the energy they consume, before applying any offsets. They must also report their energy production and consumption.
- How reliable is the data? Companies report their own emissions using activity data and approved calculation methods. They can opt for voluntary audits, or the CER might audit them. The CER looks for reasonable assurance—high confidence but not absolute certainty. Ultimately, emissions data is laden with estimates and assumptions.
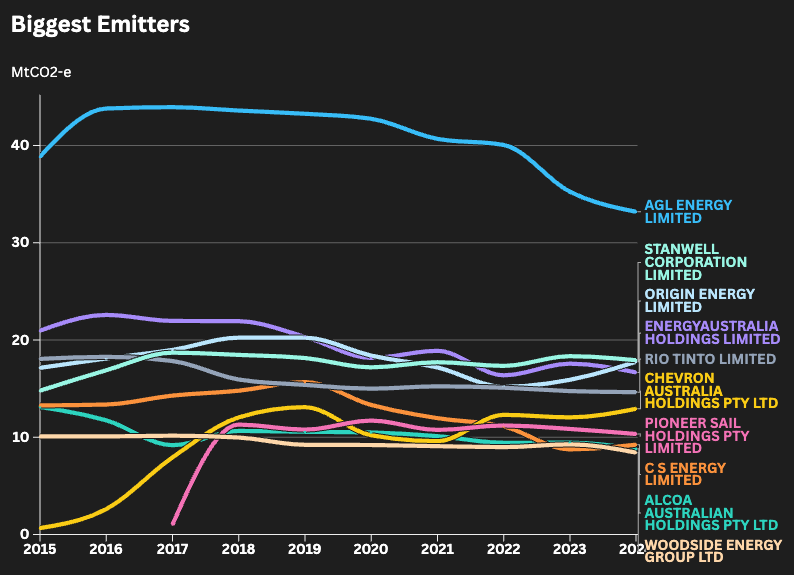
Australia's 10 Biggest Corporate Emitters
Here are Australia's 10 biggest corporate emitters, the million tonnes of carbon dioxide equivalent (Mt CO₂-e) they released last financial year (2023-24) and the percentage change on the previous year.
- AGL ENERGY LIMITED: 33.18 (-5.90%)
- STANWELL CORPORATION LIMITED: 17.92 (-2.30%)
- ORIGIN ENERGY LIMITED 17.76 (+11.60%)
- ENERGYAUSTRALIA HOLDINGS LIMITED: 16.67 (-5.10%)
- RIO TINTO LIMITED: 14.64 (-0.80%)
- CHEVRON AUSTRALIA HOLDINGS PTY LTD: 12.93 (+7.30%)
- PIONEER SAIL HOLDINGS PTY LIMITED: 10.34 (-4.80%)
- CS ENERGY LIMITED: 9.24 (+5.50%)
- ALCOA AUSTRALIAN HOLDINGS PTY LTD: 8.81 (-6.70%)
- WOODSIDE ENERGY GROUP LTD: 8.43 (-9.10%)
What changed?
- Origin Energy overtook Energy Australia to become 3rd biggest emitter.
- CS Energy leapfrogged Alcoa and Woodside to become 8th biggest.
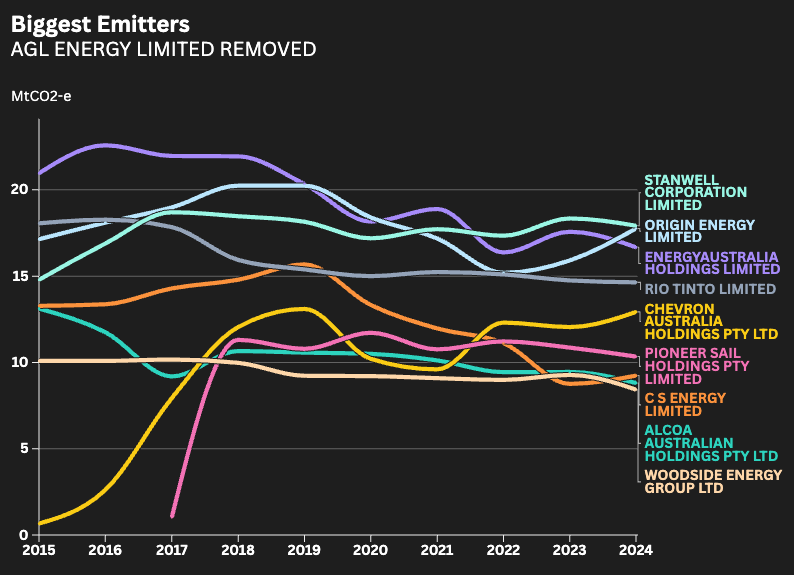
Here's the same chart with AGL removed, for a clearer picture of the others.
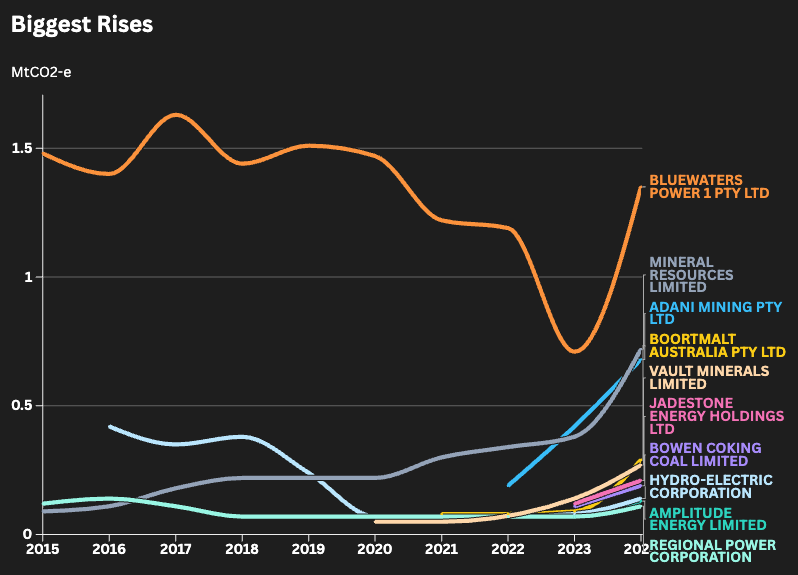
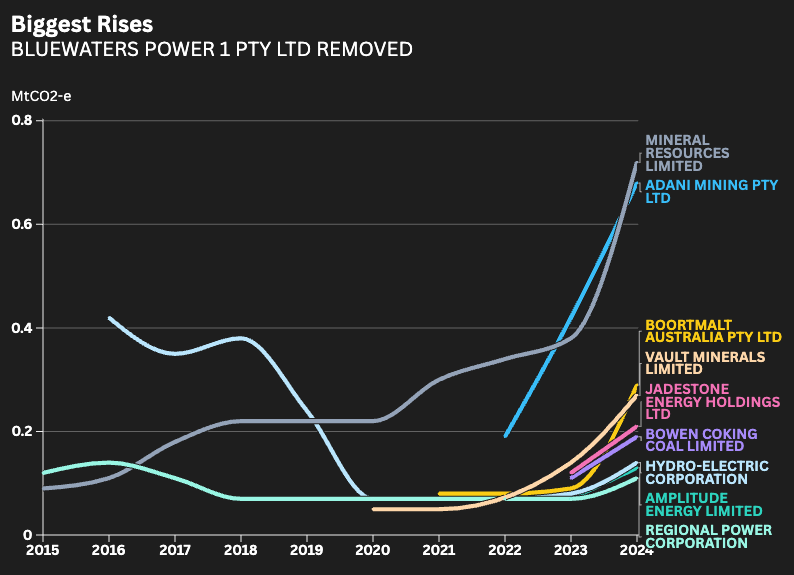
Biggest Rises
Here are the companies that reported the biggest percentage increases in emissions:
- BOORTMALT AUSTRALIA PTY LTD: 0.286 (+232.40%)
- VAULT MINERALS LIMITED: 0.274 (+90.60%)
- MINERAL RESOURCES LIMITED: 0.716 (+90.00%)
- BLUEWATERS POWER 1 PTY LTD: 1.35 (+89.60%)
- BOWEN COKING COAL LIMITED: 0.19 (+77.80%)
- AMPLITUDE ENERGY LIMITED: 0.13 (+73.50%)
- JADESTONE ENERGY HOLDINGS LTD: 0.214 (+71.40%)
- HYDRO-ELECTRIC CORPORATION: 0.136 (+65.00%)
- ADANI MINING PTY LTD: 0.675 (+59.60%)
- REGIONAL POWER CORPORATION: 0.108 (+56.10%)
Here's the same chart with Bluewaters Power 1 removed, for a clearer picture of the others.
The companies that reported the biggest percentage changes tend to come off a low base. Below are the companies that emitted more than 1 Mt CO₂-e, which reported the biggest rises.
Biggest Rises Among Bigger Emitters
- BLUEWATERS POWER 1 PTY LTD: 1.35 (+89.60%)
- APA INFRASTRUCTURE LIMITED: 2.05 (+33.70%)
- BLUEWATERS POWER 2 PTY LTD: 1.24 (+28.40%)
- STANMORE RESOURCES LIMITED: 1.11 (+22.10%)
- QGC MIDSTREAM INVESTMENTS PTY LTD: 1.94 (+15.70%)
- INPEX HOLDINGS AUSTRALIA PTY LTD: 6.7 (+14.70%)
- YANCOAL AUSTRALIA LTD: 2.97 (+11.90%)
- ORIGIN ENERGY LIMITED: 17.76 (+11.60%)
- FORTESCUE LTD: 2.52 (+10.60%)
- WHITEHAVEN COAL LIMITED: 1.37 (+7.90%)
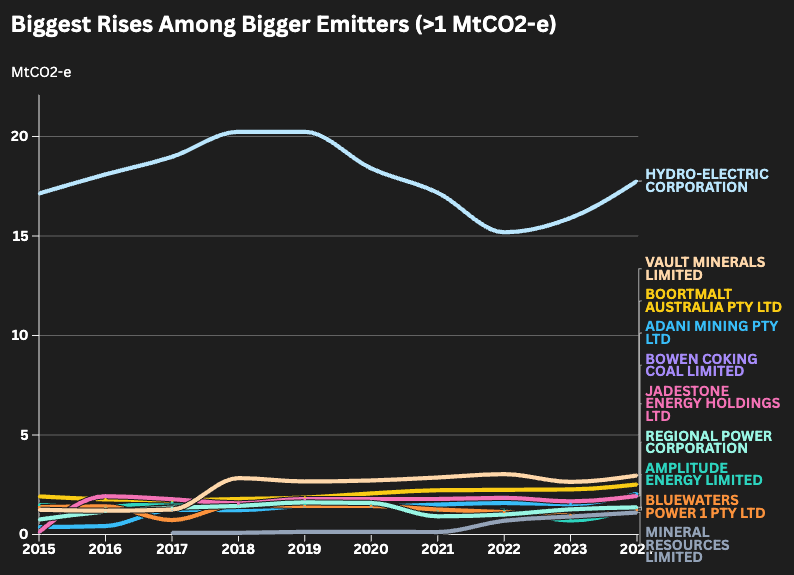
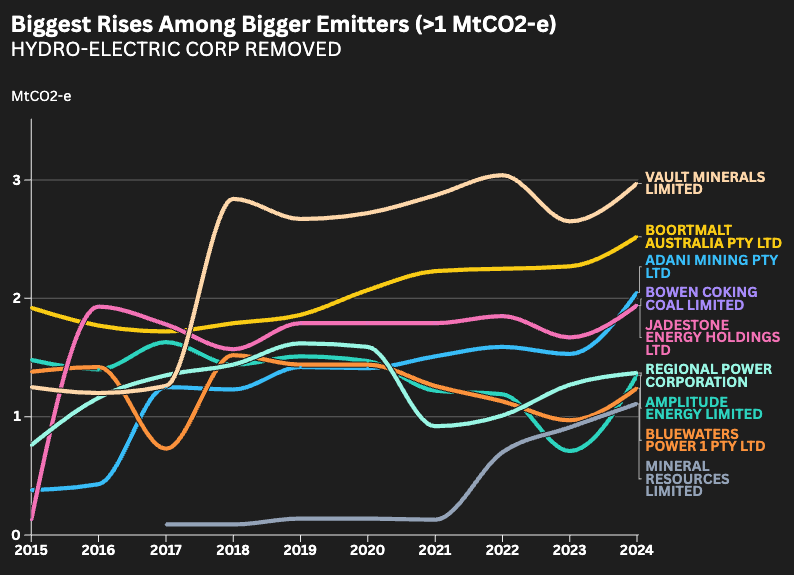
Here's the same chart with Hydro-Electric removed, for a clearer picture of the others.
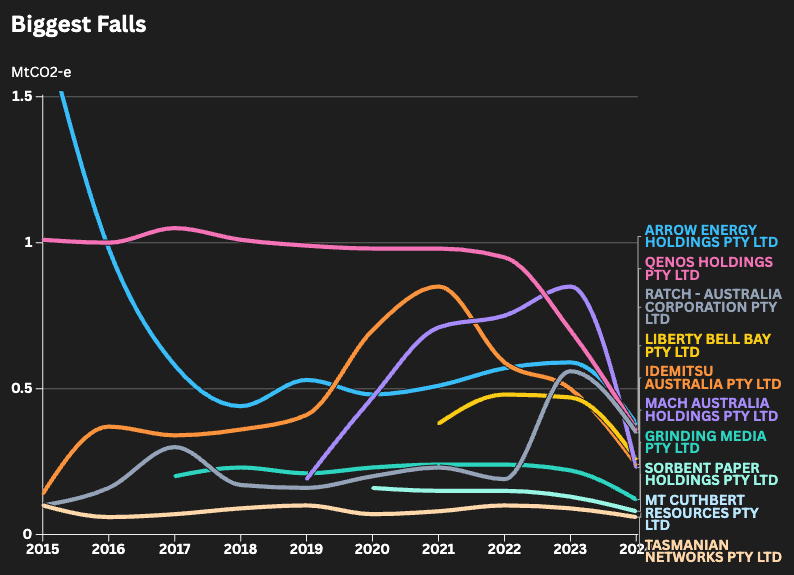
Biggest Falls
Here are the companies that reported the biggest percentage drops in emissions:
- MACH AUSTRALIA HOLDINGS PTY LTD: 0.228 (-73.20%)
- IDEMITSU AUSTRALIA PTY LTD: 0.237 (-52.60%)
- QENOS HOLDINGS PTY LTD: 0.364 (-47.80%)
- GRINDING MEDIA PTY LTD: 0.12 (-46.30%)
- LIBERTY BELL BAY PTY LTD: 0.263 (-43.90%)
- MT CUTHBERT RESOURCES PTY LTD: 0.055 (-41.00%)
- RATCH - AUSTRALIA CORPORATION PTY LTD: 0.347 (-38.20%)
- TASMANIAN NETWORKS PTY LTD: 0.061 (-35.40%)
- ARROW ENERGY HOLDINGS PTY LTD: 0.383 (-35.20%)
- SORBENT PAPER HOLDINGS PTY LTD: 0.084 (-35.00%)
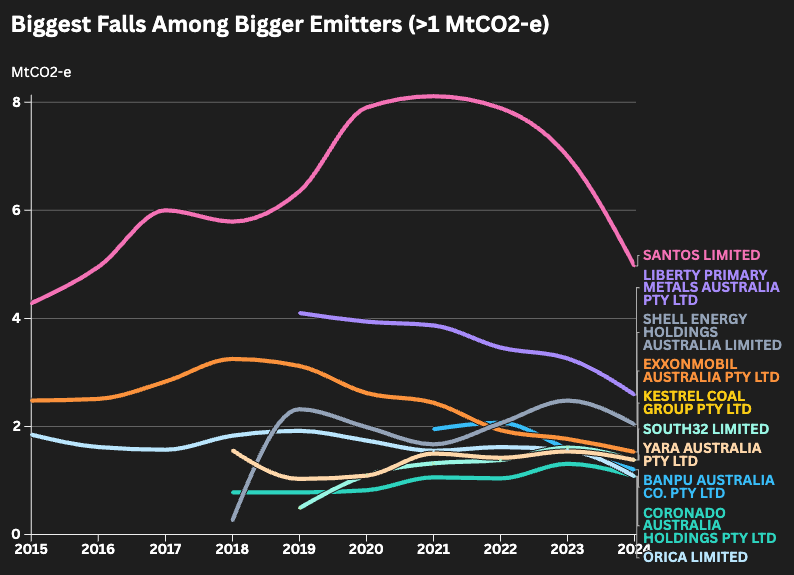
And again, to account for the low base, here are the companies that emitted more than 1 Mt CO₂-e, which reported the biggest falls.
Biggest Falls Among Bigger Emitters:
- ORICA LIMITED: 1.08 (-31.00%)
- SANTOS LIMITED: 4.97 (-29.00%)
- BANPU AUSTRALIA CO. PTY LTD: 1.2 (-24.20%)
- LIBERTY PRIMARY METALS AUSTRALIA PTY LTD: 2.59 (-20.50%)
- SHELL ENERGY HOLDINGS AUSTRALIA LIMITED: 2.04 (-18.00%)
- CORONADO AUSTRALIA HOLDINGS PTY LTD: 1.08 (-17.70%)
- KESTREL COAL GROUP PTY LTD: 1.38 (-14.00%)
- SOUTH32 LIMITED: 6.01 (-13.80%)
- EXXONMOBIL AUSTRALIA PTY LTD: 1.53 (-13.50%)
- YARA AUSTRALIA PTY LTD: 1.38 (-10.00%)
Here's what this data doesn't tell us: the reasons for the rises and falls or how they relate to real-world emissions. Reductions may come from energy efficiencies or climate transition plans, like AGL closing the Liddell Power Station. But they could also result from accounting tactics, such as reclassifying operations or offloading high-emission assets. To know more, we will need to dig much further.
What We’re Reading
What’s Driving Cyclone Alfred?
Cyclone Alfred is unusual. ‘When unusual disasters strike, people naturally want to know what role climate change played – a process known as “climate attribution”. Unfortunately, this process takes time.’ Three scientists outline what is known and unknown about climate change’s influence on Alfred. Its southerly path isn’t necessarily linked. Warmer seas and heavier rainfall are. Bigger storm surges, driven by rising sea levels, are clearly connected. (The Conversation)
An emissions modeller explains how he calculates greenhouse gases from iron, bauxite, and copper mining. First, build a visual history of the mine using satellite images and radar data. More change means more mining, typically leading to higher emissions. Factor in machinery differences and effort, such as extracting copper from deep underground versus bauxite closer to the surface. The main metric is truck fuel usage. Mining trucks may operate 24 hours a day, burning 3,000–4,000 litres of diesel daily. (Climate TRACE)
Headlines To Watch
- Dutton’s anti-offshore wind agenda halts project, Sydney Morning Herald, 28 Feb
- Wells Fargo drops financed emissions target amid ESG rethink, Reuters, 28 Feb
- Federal government rejects Seadragon offshore windfarm project in Gippsland, ABC, 4 Mar
- Gas wars erupt as Coalition pledges to unleash ‘bucketloads’ of fuel, Sydney Morning Herald, 5 Mar
- Risk of natural disasters pushes insurance premiums up. ABC, 6 March
- Global sea ice hit record low in February, scientists say, The Guardian, 6 Mar
- US pulls out of flagship $45bn global climate finance coalition, Financial Times, 7 March
Data Updates
- New car sales in February:
- Australian Carbon Credit Units (ACCUs) issued in February:
- Last month: +834,541 ACCUs issued
- Running total (FY24/25): 11,958,808
- What this means: Nearly 12 million tonnes of carbon dioxide equivalent (CO₂-e) deemed to have been removed or prevented from entering the atmosphere, so far this financial year. (Roughly equivalent to emissions from Eraring Power Station).
- Energy fuel mix this week in the National Electricity Market (NEM):
- Biggest day for renewables: 47.0% on Thursday 6 March
- Smallest day for renewables: 40.8% on Saturday 1 March
- Yesterday’s breakdown:
- Coal (Black): 38.5 %
- Wind: 20.9 %
- Solar (Rooftop): 12.9 %
- Coal (Brown): 12.8 %
- Solar (Utility): 9.8 %
- Hydro: 3.8 %
- Gas: 2.3 %
- Bioenergy: 0.1 %
Final Thought
'It depends on many barely known and many unknown things.'
— Bruce Mountain
That's your climate data briefing for this week. Thanks for reading and see you again soon.
💛 Juliette and the OnlyFacts team.