On this page
This article relates to the country emissions data on OnlyFacts. Find climate data overwhelming? Make sure you’re signed up for our free weekly briefing and social channels, where we break it down and send updates.
Why Country Emissions Data Matters
Greenhouse gases pose a global challenge. Each country's emissions affect our shared atmosphere. In 2021, 197 countries agreed to the Glasgow Climate Pact at COP26, which:
- Reaffirmed the Paris Agreement's goal to limit global temperature rise to well below 2 °C above pre-industrial levels, aiming for 1.5 °C.
- Recognised that achieving this goal requires 'rapid, deep and sustained reductions in global greenhouse gas emissions, including reducing global carbon dioxide emissions by 45 per cent by 2030 relative to the 2010 level and to net zero around midcentury as well as deep reductions in other greenhouse gases'.
How To Use The Country Lists
There are two lists for country emissions:
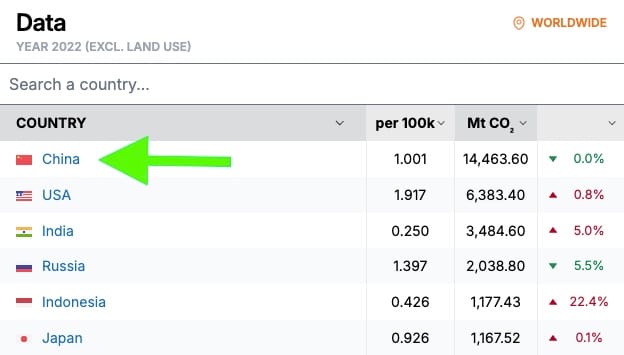
Every country name is a hyperlink. Click on it to access the full emissions data history.
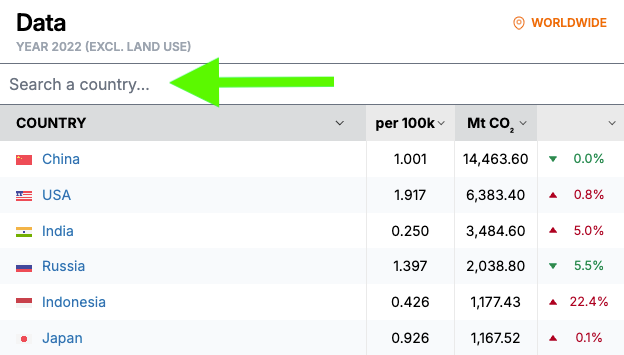
- Type in the search bar to find a country.
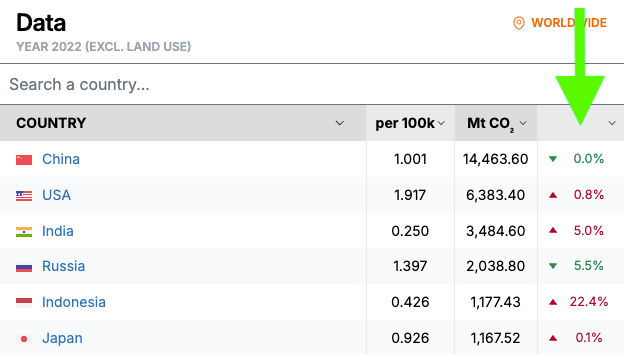
- The final column shows percentage change between the last reports.
About This Data
- The global emissions data on OnlyFacts is sourced from Germany's Potsdam Institute for Climate Impact Research (PRIMAP-hist).
- This dataset reports CO₂ emissions, excluding other greenhouse gases like methane. (Read this Beginner's Guide to Greenhouse Gases).
- This dataset excludes emissions from the Land Use, Land-Use Change, and Forestry (LULUCF) sector (abbreviated by OnlyFacts to Land Use). Land Use refers to human activities that impact how land is used and managed, particularly concerning forests and crops.
- PRIMAP-hist explains why they excluded this from the data:
LULUCF data has high annual fluctuations which makes it difficult to combine datasets by scaling of one dataset to match the other (and use the growth rates of the scaled dataset to extend the other dataset). Thus in PRIMAP-hist v1 we used unscaled data, which introduces sudden changes in emissions timeseries that were often understood by users as changes in actual emissions instead of changes in underlying dataset. LULUCF emissions estimates vary strongly between different datasets and the methodologies used can be very different. There are also changes in methodologies within datasets, which again introduce sudden emissions changes into the timeseries. With the data currently available, we cannot produce time series that fulfill our requirements for internal consistency and easy usability by a broad audience. Describing the inconsistencies and the limitations to the use of the dataset resulting from these issues has proven not to suffice as the LULUCF data lead to misunderstandings. Thus we have decided to stop publishing LULUCF timeseries until either there are more consistent datasets or we develop an improved methodology to create a consistent and easy to use LULUCF dataset.
Why Track Raw and Per Capita Emissions
OnlyFacts tracks both total and per capita emissions. Per capita emissions are adjusted relative to population size. On our country emissions page, the 'per 100k' column indicates emissions per 100,000 people. We track both because:
- Total emissions reflect a country's absolute impact on the atmosphere
- Per capita emissions standardise data, facilitating comparisons across different population sizes.