1. Data

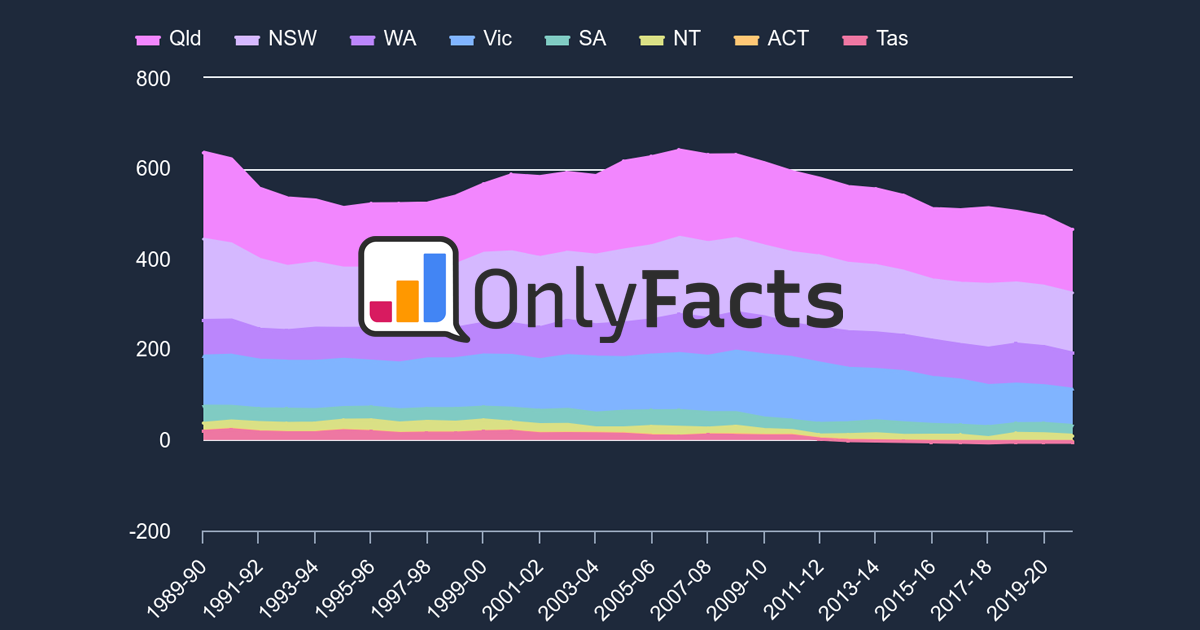
This data excludes emissions from the Land Use, Land-Use Change and Forestry (LULUCF) sector. Here's why. What is Mt CO₂-e? Emissions are a combination of gases. Most are Carbon Dioxide (CO₂). The other gases are measured as a Carbon Dioxide equivalent (CO₂-e) based on the amount of heat they trap in the atmosphere. They’re measured in Million Tonnes (Mt).

Sweden

Emissions History (excl. LULUCF) - Pop. 10.16M

sweden

Source: PRIMAP-hist via OnlyFacts

Data

Emissions History (excl. LULUCF) - Pop. 10.16M

sweden

YEAR

per 100k

Mt CO₂-e

NET

1900 0.234 23.79 -
1901 0.221 22.44 5.7%
1902 0.229 23.29 3.8%
1903 0.247 25.09 7.8%
1904 0.259 26.29 4.8%
1905 0.255 25.89 1.5%
1906 0.278 28.29 9.2%
1907 0.311 31.58 11.6%
1908 0.327 33.19 5.1%
1909 0.304 30.89 6.9%
1910 0.315 32.02 3.6%
1911 0.306 31.14 2.7%
1912 0.336 34.16 9.7%
1913 0.373 37.89 10.9%
1914 0.354 36.01 5.0%
1915 0.357 36.24 0.6%
1916 0.374 37.97 4.8%
1917 0.189 19.24 49.3%
1918 0.216 21.91 13.9%
1919 0.205 20.82 5.0%
1920 0.262 26.59 27.7%
1921 0.171 17.42 34.5%
1922 0.253 25.74 47.7%
1923 0.298 30.26 17.6%
1924 0.345 35.10 16.0%
1925 0.312 31.72 9.6%
1926 0.305 30.95 2.4%
1927 0.410 41.69 34.7%
1928 0.373 37.92 9.0%
1929 0.437 44.45 17.2%
1930 0.425 43.18 2.9%
1931 0.423 43.01 0.4%
1932 0.418 42.44 1.3%
1933 0.433 43.98 3.6%
1934 0.477 48.41 10.1%
1935 0.497 50.45 4.2%
1936 0.541 54.92 8.9%
1937 0.616 62.61 14.0%
1938 0.553 56.18 10.3%
1939 0.615 62.45 11.2%
1940 0.422 42.92 31.3%
1941 0.368 37.37 12.9%
1942 0.329 33.43 10.5%
1943 0.391 39.69 18.7%
1944 0.325 33.00 16.9%
1945 0.162 16.47 50.1%
1946 0.381 38.69 135.0%
1947 0.505 51.32 32.6%
1948 0.622 63.22 23.2%
1949 0.553 56.23 11.0%
1950 0.587 59.65 6.1%
1951 0.653 66.37 11.3%
1952 0.665 67.58 1.8%
1953 0.613 62.29 7.8%
1954 0.628 63.80 2.4%
1955 0.677 68.82 7.9%
1956 0.714 72.54 5.4%
1957 0.644 65.46 9.8%
1958 0.671 68.18 4.2%
1959 0.675 68.62 0.6%
1960 0.748 75.95 10.7%
1961 0.744 75.56 0.5%
1962 0.762 77.39 2.4%
1963 0.805 81.80 5.7%
1964 0.857 87.11 6.5%
1965 0.871 88.46 1.6%
1966 0.969 98.45 11.3%
1967 0.935 94.96 3.6%
1968 1.015 103.09 8.6%
1969 1.103 112.06 8.7%
1970 1.141 115.89 3.4%
1971 1.064 108.09 6.7%
1972 1.072 108.88 0.7%
1973 1.115 113.30 4.1%
1974 1.040 105.62 6.8%
1975 1.030 104.65 0.9%
1976 1.105 112.26 7.3%
1977 1.071 108.81 3.1%
1978 1.010 102.57 5.7%
1979 1.072 108.97 6.2%
1980 0.936 95.06 12.8%
1981 0.901 91.57 3.7%
1982 0.819 83.26 9.1%
1983 0.783 79.57 4.4%
1984 0.779 79.14 0.5%
1985 0.824 83.69 5.8%
1986 0.812 82.53 1.4%
1987 0.786 79.81 3.3%
1988 0.761 77.28 3.2%
1989 0.738 75.01 2.9%
1990 0.707 71.86 4.2%
1991 0.708 71.97 0.1%
1992 0.705 71.59 0.5%
1993 0.707 71.86 0.4%
1994 0.732 74.35 3.5%
1995 0.726 73.74 0.8%
1996 0.764 77.67 5.3%
1997 0.716 72.70 6.4%
1998 0.720 73.14 0.6%
1999 0.689 70.01 4.3%
2000 0.676 68.73 1.8%
2001 0.684 69.48 1.1%
2002 0.689 70.03 0.8%
2003 0.693 70.42 0.6%
2004 0.687 69.76 0.9%
2005 0.658 66.88 4.1%
2006 0.655 66.50 0.6%
2007 0.643 65.34 1.8%
2008 0.619 62.93 3.7%
2009 0.577 58.65 6.8%
2010 0.637 64.76 10.4%
2011 0.594 60.30 6.9%
2012 0.565 57.40 4.8%
2013 0.549 55.76 2.9%
2014 0.532 54.01 3.1%
2015 0.522 53.05 1.8%
2016 0.524 53.19 0.3%
2017 0.513 52.10 2.0%
2018 0.505 51.29 1.6%
2019 0.496 50.43 1.7%
2020 0.454 46.11 8.6%
2021 0.473 48.09 4.3%
2022 0.480 48.73 1.3%

Source: PRIMAP-hist via OnlyFacts

News

Sign up to the free weekly climate data briefing